
Probabilistic trading means you treat each trade as a statistical experiment and judge success by expectancy and process adherence, not single outcomes. The core anchors are simple: calculate expected value before you risk capital, size positions so no single loss can knock you out of the game, and log every probability estimate against what actually happens. Start today, one trade at a time.
TL;DR:
- Most profitable strategies can have lower win rates if the payoff ratio is high enough, emphasizing the importance of expected value over win frequency.
- Reliable edge confirmation requires large sample sizes, with very large samples needed to trust the calculated advantage in trading.
- Proper position sizing, such as fixed fractional or reduced Kelly, is essential to prevent ruin even with a positive expectancy system.
- Regular calibration of probability estimates reveals estimation bias and helps improve decision accuracy over time.
- Behavioral biases like overconfidence and confirmation bias can undermine probabilistic trading unless mitigated by disciplined rules and structured review.
Table of Contents
- What Probabilistic Thinking Means for Traders
- Core Math: Expected Value, Sample Size, and the Law of Large Numbers
- Position Sizing and Risk Management Built Around Probability
- Calibration: Testing Whether Your Probability Estimates Hold Up
- Behavioral Obstacles That Sabotage Probabilistic Trading
- A Reproducible Workflow for Scoring Trading Decisions
- Tools and Models for Probability-Driven Trading
- Where Probabilistic Thinking Corrects Common Mistakes
- Why a Process-First Approach to Probability Outlasts Every Shortcut
- Sources
What Probabilistic Thinking Means for Traders
Probabilistic thinking in trading is the practice of assigning a realistic probability to each outcome of a trade, then acting on the math instead of your gut feeling about whether "this one" will work. You are not predicting the future. You are estimating odds and betting when the odds favor you enough to cover your costs and your losses.
This is a mindset shift most traders never make, and it's the one Mark Douglas spent his career hammering on. Douglas argued that consistent traders detach emotionally from any single trade's outcome because they understand that no individual result tells you anything reliable about your edge. A loss doesn't mean your analysis was wrong. A win doesn't mean it was right. Only the aggregate result across many trades, executed the same way, tells you the truth.
Traders who cling to outcome attachment treat each trade like a verdict on their skill. Traders who adopt process adherence treat each trade like one data point in a much larger sample. The difference shows up in daily behavior:
- They size the next trade the same way regardless of whether the last three were winners or losers.
- They review whether they followed their entry and exit rules, not just whether the trade made money.
- They accept that a well-reasoned trade can lose and a poorly-reasoned trade can win, without updating their process based on either.
- They track calibration (whether their stated probabilities match reality) as a separate metric from raw profit and loss.
Probabilistic thinking also reframes what a "good decision" looks like. A trade that loses money after correctly identified odds and proper sizing is still a good decision, executed on unfavorable variance. A trade that makes money by ignoring your own risk rules is still a bad decision, one that got lucky. Traders who understand mispricing between market-implied odds and their own estimated probabilities stop asking "will this work?" and start asking "does my estimate diverge enough from the market's estimate to justify the risk?" That's the actual question probabilistic trading answers.
Core Math: Expected Value, Sample Size, and the Law of Large Numbers
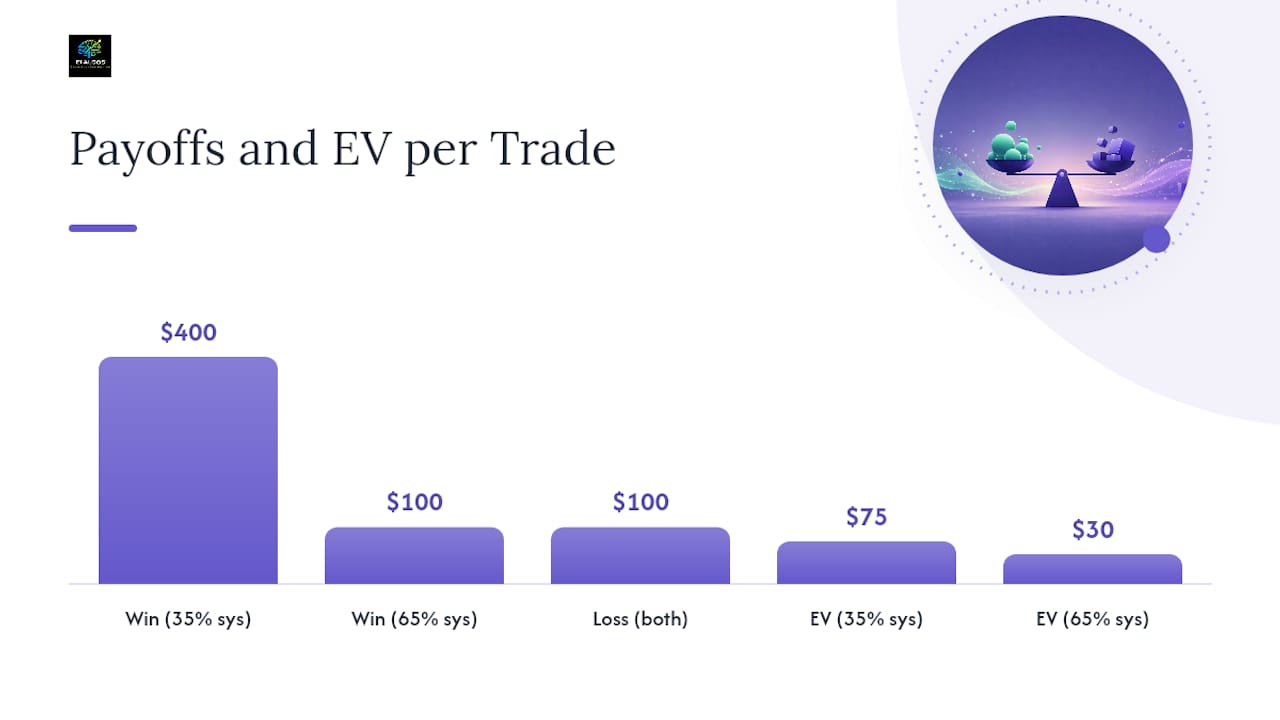
Expected value is the single number that tells you whether a strategy has an edge before you ever place a trade. The formula: EV = (Probability of Win × Average Win) − (Probability of Loss × Average Loss) − Costs.
Here's where most new traders get the intuition backwards. A strategy with a 35% win rate can be far more profitable than one with a 65% win rate, depending on the payoff ratio. Say you win 35% of the time with an average gain of $400, and lose 65% of the time with an average loss of $100. Your EV per trade is (0.35 × $400) − (0.65 × $100) = $140 − $65 = $75 positive expectancy per trade, before costs. Compare that to a system with a 65% win rate, but a 1:1 reward-to-risk profile where wins and losses are both $100. That EV is (0.65 × $100) − (0.35 × $100) = $30. The higher win rate feels more comfortable. It's also the weaker system.
Calibration and edge only reveal themselves over volume. The law of large numbers means a real edge doesn't show up reliably in 10 or even 20 trades. Many professional traders treat a large sample of trades as the minimum before they trust an observed win rate or EV.
Use this rough guide when judging your own results:
- Small sample sizes provide almost no statistical information, so treat any conclusion as speculation.
- Medium sample sizes allow patterns to emerge, but variance can still dominate.
- Larger sample sizes enable tentative conclusions about win rate and average payoff.
- Very large samples are needed to trust calculated edge, assuming reasonably consistent market conditions.
Once you trust an edge, sizing becomes the next problem. The Kelly criterion calculates the theoretically optimal bet size as a function of your edge and payoff odds, but full Kelly sizing is aggressive enough to produce brutal drawdowns even with a real edge. Most practitioners use a fraction of Kelly, often a quarter or half, to reduce variance while still scaling with edge strength. Improper sizing can turn a genuinely profitable edge into a ruinous outcome, which is the entire concept behind risk-of-ruin math: the probability that a losing streak, combined with oversized bets, wipes out your account before your edge has time to play out.
Position Sizing and Risk Management Built Around Probability
Your EV calculation is only theoretical until position sizing turns it into real dollars at real risk. Get sizing wrong and a positive-expectancy system can still bankrupt you through bad luck timing, or through bets too large to survive the losing streaks that a real edge guarantees will eventually happen.
Fixed fractional sizing, where you risk a consistent small percentage of account equity per trade, is the simplest defense against ruin. It scales your risk down automatically as your account shrinks and up as it grows, which keeps a bad stretch from compounding into a catastrophe. Reduced Kelly heuristics push this further by tying position size to your calculated edge, so stronger setups get proportionally more capital and marginal setups get less.
A few rules worth enforcing regardless of your specific sizing model:
- Cap your daily loss at a fixed small percentage of account equity and stop trading once you hit it, no exceptions.
- Never risk more than a small, fixed fraction of your account on any single idea, regardless of how confident you feel.
- Scale into positions in tranches rather than committing full size at entry, which limits damage if your initial read was wrong.
- Reduce size automatically when your probability estimate comes from a thinner sample or a less familiar setup type.
Pro Tip: Keep a separate, smaller "size multiplier" for any setup you haven't logged at least a moderate number of times. Confidence should scale with data, not with how the last few trades went.
The trickiest calibration problem is sizing under uncertainty about your own uncertainty. If you're not sure your 65% probability estimate is actually 65%, the safest move is to size as if it were meaningfully lower, maybe 55%, until your journal proves otherwise. Detailed position-sizing frameworks and worked risk examples can help you formalize this instead of guessing trade by trade. Traders navigating unstable macro conditions face this problem constantly. A checklist approach to investing during economic uncertainty reinforces the same principle from a portfolio angle: reduce conviction-driven sizing when the inputs themselves are shaky.
Calibration: Testing Whether Your Probability Estimates Hold Up
Calibration measures something different from accuracy. Accuracy asks whether you were right. Calibration asks whether your confidence level matched reality across many predictions. For example, a trader who says "70% probability" on different trades should win roughly 70% of those trades. If the actual win rate is significantly lower, the estimation process itself is broken, separate from whatever the market did.
Running a calibration test doesn't require special software. Then check the actual win rate inside each bin against many trades logged over time.
Calibration gaps reveal estimation bias, not bad luck. If your 70%-confidence trades only win 55% of the time, the problem is systematic overconfidence in your process, and no amount of additional trades will fix it without correcting the estimation habit itself.
Two miscalibration patterns show up constantly among self-directed traders:
- Overconfidence clustering: Your 80 to 90% bin performs like a 60% bin. This usually means you're anchoring on setups that look clean visually but carry hidden risk you're not pricing in.
- Underconfidence on strong setups: Your 60% bin actually wins 75% of the time. This often means fear or past losses are causing you to undersize or skip genuinely strong opportunities.
Correct either pattern by re-weighting your future estimates toward the bin's realized frequency, not your gut instinct.
Recalibrate on a fixed schedule, monthly is reasonable for active traders, rather than reacting to any single winning or losing streak. Log the predicted probability, the actual outcome, position size, and a one-line note on setup type every time. That log is what eventually turns gut-feel confidence into a number you can trust.
Behavioral Obstacles That Sabotage Probabilistic Trading
Knowing the math doesn't automatically install the discipline to follow it. Several well-documented biases actively work against probabilistic thinking, and they show up in almost every trading account eventually.
Loss aversion makes losses feel roughly twice as painful as equivalent gains feel good, which pushes traders to cut winners early and let losers run, the exact opposite of what a positive-EV system usually requires. Outcome bias convinces you that a losing trade must have been a bad decision, even when the process was sound and the variance was simply unfavorable. Anchoring locks your read of a setup to the first number you saw, an entry price, a target, a headline, even after new information should have changed your estimate. Confirmation bias makes you notice evidence supporting a trade you already want to take, while filtering out contradicting signals. Escalation of commitment keeps you adding to a losing position because you've already committed capital and ego to being right.
Countering these takes short, enforceable rules rather than willpower alone:
- Run a pre-trade checklist that forces you to state your probability estimate, your EV, and your position size before you look at the chart's short-term movement.
- Ask one audit question after every trade closes: "Was execution correct according to plan?" not "Did it win?"
- Journal the process grade separately from the dollar result, so a well-executed loser scores differently than a rule-breaking winner.
- Review your anchoring and confirmation bias patterns on a recurring basis rather than only after a bad week.
Pro Tip: Grade every trade A through F on process alone, entry criteria met, sizing correct, exit followed the plan, before you even look at the P&L. Traders who separate the two grades stop confusing lucky mistakes with good decisions.
A Reproducible Workflow for Scoring Trading Decisions
A workflow turns probabilistic thinking from an abstract mindset into something you actually do every trading day. The structure is straightforward, but the discipline to run it consistently is where most self-directed traders fall short.
The sequence looks like this:
- Estimate probability: Assign a specific number, not a vague "I feel good about this," based on your setup criteria and market context.
- Compute EV: Run the win probability, average win, average loss, and estimated costs through the formula before entry.
- Decide size: Match position size to both your EV and your confidence in the probability estimate itself.
- Execute: Enter and manage according to the plan you set before emotion had a chance to interfere.
- Log the outcome: Record predicted probability, actual result, size used, and a short process note immediately after the trade closes.
- Run calibration monthly: Bin your logged trades and check whether your stated probabilities matched realized frequencies.
A useful mental model behind this workflow is a multi-factor decision score, evaluating a setup across several independent dimensions such as setup quality, market context, personal emotional state, position sizing discipline, timing, and historical performance in similar conditions, rather than relying on a single gut-feel confidence number. Scoring across factors surfaces disagreements a single number hides. A setup might look strong technically but score poorly on emotional state if you're trading after two consecutive losses, which is exactly the situation where escalation of commitment tends to strike.
Aggregate metrics collected over weeks or months diagnose specific behavioral error types instead of vague dissatisfaction with "how trading is going." A falling adherence rate, meaning fewer trades follow your stated pre-trade plan, points to execution discipline problems. A widening calibration gap points to estimation bias. A shrinking average decision score across a losing streak points to emotional interference creeping into your process, distinct from a losing streak that happens on high, stable decision scores, which is simply variance. This kind of structured review is precisely what process-oriented trading and decision-intelligence frameworks are built to formalize, and the same logic applies whether you're tracking it in a spreadsheet or a purpose-built tool.
Tools and Models for Probability-Driven Trading
You don't need institutional infrastructure to bring rigor into your process. Logistic regression models can estimate the probability of a binary outcome (breakout versus failure, for instance) based on a handful of input variables you already track. Bootstrap backtests resample your historical trade data repeatedly to generate a range of plausible outcomes, showing you the distribution of results your strategy might have produced rather than one lucky or unlucky historical path. Monte Carlo scenario testing runs your strategy through thousands of randomized sequences to reveal how sensitive your results are to the order in which wins and losses occurred.
Every one of these models is only as useful as the execution assumptions built into it. Persistent slippage, even small amounts, compounds across many trades and can quietly erase an apparent edge that looked solid in a backtest with idealized fills.
The core architecture behind most probability-driven systems compares a model's estimated probability against the price the market is implicitly offering, and only trades when that gap exceeds transaction costs by a comfortable margin. That means before you size anything, you subtract slippage, fees, and realistic liquidity constraints from your model's raw probability estimate, not after the fact.
Track these on an ongoing dashboard regardless of how sophisticated your modeling gets:
- EV per trade, updated with real fills, not idealized entry and exit prices.
- Calibrated probability bins, refreshed monthly against actual outcomes.
- A running calibration chart showing whether your estimation accuracy is improving or drifting.
- Adherence rate, the percentage of trades executed exactly according to your pre-trade plan.
Macro context matters here too. Traders watching conflicting economic indicators often see their model probabilities and market-implied probabilities diverge the most during exactly these periods, which is either a real opportunity or a sign your model's inputs have gone stale. Calibration data is what tells you which one it is.
Where Probabilistic Thinking Corrects Common Mistakes
Three recurring errors show up across almost every self-directed trader's history, and probability-based math corrects each one cleanly.
- Chasing win rate over payoff: A system winning a lower percentage of the time at a higher reward-to-risk ratio can produce higher EV per trade than a system with a higher win rate but lower reward-to-risk ratio. The lower win rate system is mathematically superior, even though it "feels" worse day to day.
- Abandoning a system too early: Quitting after a small number of losing trades ignores that meaningful sample sizes are needed to determine if your edge is real. Small samples tell you almost nothing about the true probability of success.
- Confusing variance with system failure: A quick diagnostic, check your calibration gap and adherence rate before touching your strategy rules. Stable process scores through a losing streak usually mean variance. Declining scores mean something in your execution actually broke.
Why a Process-First Approach to Probability Outlasts Every Shortcut
I keep coming back to the same observation after looking at how probabilistic trading actually gets applied versus how it gets talked about online: most traders understand the EV formula within a week. Almost none of them build the habit of logging their probability estimate before the trade, which is the only part of this system that actually produces useful data over time.
The math isn't the hard part. The hard part is treating your own confidence as a number worth measuring against reality, month after month, especially when a losing streak makes you want to abandon a perfectly calibrated process for a "feel" that just lost you money. That's where a decision score, scoring the setup, your sizing discipline, your emotional state, separately from the outcome earns its place. It catches drift before your account does.
Start small. Score one trade a day on process alone before you look at the profit or loss. Keep the calibration log even on days it feels pointless. Six months from now, that log is either going to validate an edge you can trust with real size, or it's going to save you from an edge that never existed. Either answer is worth having.
— Anantha
Sources
For deeper mathematical grounding, an academic treatment of probabilistic forecasting in trading covers the formal theory behind these concepts. For a continuing, structured education on decision-intelligence practice, Eialgos maintains a Knowledge Hub on behavioral decision intelligence built around the same process-first principles covered here.
- Thinking in Probabilities: The Mental Framework That Separates Consistent Traders From the Rest - NexusFi Academy
- The only god of trading is probability — FXStreet