
A trading scorecard is a repeatable framework that scores each trade and your decision process so you can improve decision quality, not just chase P&L. Start with a minimal template today, or use Eialgos Decision Intelligence to automate behavioral scoring from trade one. Three things make a scorecard credible: a clear scoring formula, a consistent journaling habit, and a feedback loop that changes future decisions.
Key Takeaways
A trading scorecard built around expectancy, behavioral scoring, and monthly attribution produces more durable improvement than any P&L-only review.
| Point | Details |
|---|---|
| Expectancy over win rate | Expectancy (Win Rate × Avg Win R minus Loss Rate × Avg Loss R) is the true measure of edge. |
| Behavioral scoring is required | Track plan adherence, emotional control, and sizing discipline per trade — not just P&L. |
| Monthly attribution drives change | Group trades by signal tag and market regime monthly; set one process target based on findings. |
| Start minimal, then scale | Log 12 core fields consistently before adding composite scoring or automation. |
| Eialgos automates the hard parts | Eialgos scores each setup before entry using a six-factor engine, removing post-trade hindsight bias. |
This article is general information, not a substitute for advice from a qualified financial advisor. Consult a qualified financial professional about your own circumstances before acting on anything here.
Table of Contents
- What a trading scorecard actually measures — and who needs one
- Key metrics every scorecard should track — with formulas
- How to build your scorecard template from scratch
- How to use your scorecard: daily, weekly, and monthly
- Why Eialgos Decision Intelligence scales your scorecard further
- How to choose between a spreadsheet, a journal, and a Decision Intelligence platform
- What to build and measure first: your immediate next steps
- The metric most traders ignore is the one that matters most
- Eialgos scores your decisions before the trade, not after
- Sources
What a trading scorecard actually measures — and who needs one
A trading scorecard is a systematic record that captures both the numbers and the behavior behind every trade. It goes beyond profit and loss to score whether you followed your plan, sized correctly, and acted on a valid signal. The result is an objective feedback loop that removes hindsight bias and aligns your process with your stated goals.
Who benefits most? Discretionary traders who need to separate good process from lucky outcomes. Options traders tracking expiration, greeks, and assignment results. Traders validating a new strategy before scaling it. Anyone who has ever exited a trade and immediately wondered whether the decision was sound or just convenient.
A complete scorecard has four layers:
- Trade data: entry, exit, instrument, direction, size, P&L
- Risk metrics: R-multiple, drawdown, max adverse excursion (MAE)
- Behavioral checks: plan adherence, emotional control, position sizing discipline
- Attribution tags: signal ID, strategy label, market regime
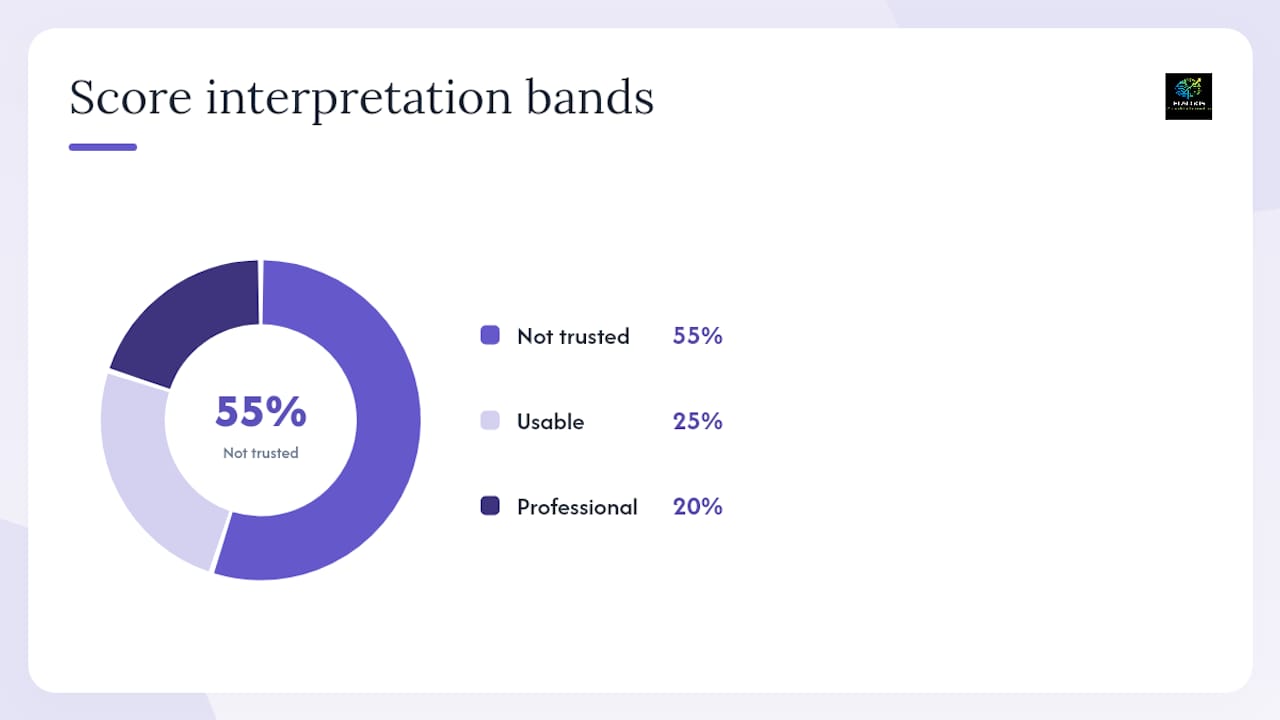
Nexural's Trade Review Scorecard frames this well: a 0–100 process score that sums weighted checklist items, with interpretation bands (80–100 = professional process; 55–79 = usable; below 55 = not trusted). The score is a review prompt and a diagnostic, not a trade signal.
Pro Tip: Set up your scorecard before you need it. Logging a trade from memory 48 hours later introduces the exact hindsight bias the scorecard is designed to eliminate.
Key metrics every scorecard should track — with formulas
Quantitative metrics give you the raw signal. Behavioral metrics tell you why the signal looks the way it does. You need both.
Core quantitative metrics
| Metric | Formula | Example |
|---|---|---|
| Win Rate | Wins ÷ Total Trades | 30 wins from the total trades result in a majority winning percentage |
| Expectancy (R) | (Win Rate × Avg Win R) − (Loss Rate × Avg Loss R) | (0.60 × 1.5R) − (0.40 × 1.0R) = +0.50R |
| Profit Factor | Gross Profit ÷ Gross Loss | $3,000 ÷ $1,500 = 2.0 |
| Max Drawdown | (Peak Equity − Trough Equity) ÷ Peak Equity | ($12,000 − $9,600) ÷ $12,000 = 20% |
| MAE | Largest adverse price move while in the trade | Stop at $100, price hit $97 before reversing: MAE = $3 |
| Avg R/R | Avg Win R ÷ Avg Loss R | 1.5R ÷ 1.0R = 1.5:1 |
| Avg Holding Time | Sum of all holding periods ÷ Total Trades | 240 minutes divided by total trades gives an average holding time of several hours |
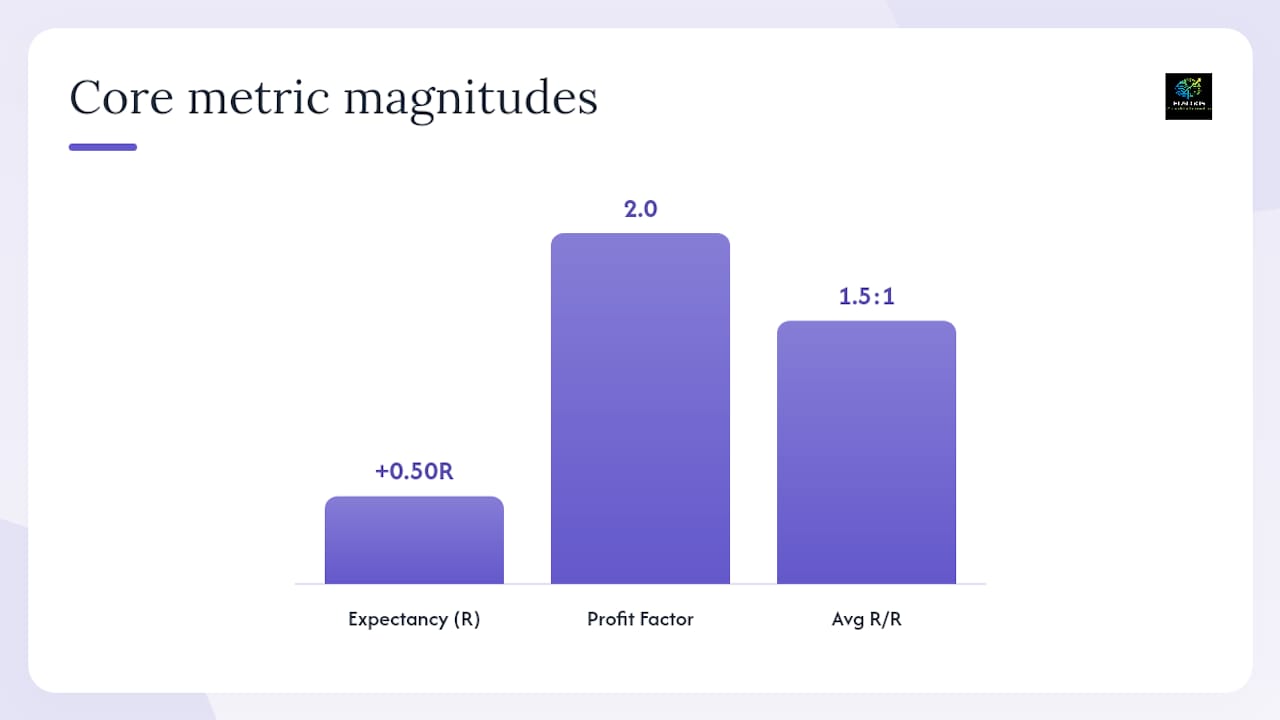
Expectancy is the single most useful number on this list. A positive expectancy means your edge is real across the sample.
Behavioral metrics
- Plan adherence rate: trades where you followed your pre-trade plan ÷ total trades
- Emotional control score: self-rated 1–5 at trade close (1 = reactive, 5 = fully disciplined)
- Position sizing adherence: trades within your stated risk-per-trade rule ÷ total trades
- Rule-following rate: checklist items completed ÷ total checklist items across all trades
Building a composite score
To normalize these onto a 0–100 scale, assign weights to each component. JournalPlus's Trading Performance Score Calculator demonstrates a weighted approach that combines profit factor, max drawdown, expectancy in R, win-rate consistency, and risk/reward into a single composite score. Multiply each normalized component by its weight, then sum.
Practitioners on Reddit's options community recommend setting an expected win rate and profit/loss range first, then comparing actual averages over time as the most practical way to scorecard options trading history.
How to build your scorecard template from scratch
A minimal, implementation-ready template needs these columns per trade:
Execution data:
- Date and time (entry)
- Instrument (ticker/contract)
- Direction (long/short)
- Entry price, stop price, target price
- Position size (shares/contracts)
- Risk in dollars and as a percentage of account
Decision context:
- Rationale/signal tag (e.g., "breakout," "mean reversion," "earnings play")
- Conviction score (1–5)
- Pre-trade notes (market state, sector context, portfolio position)
Outcome data:
- Exit price and time
- P&L in dollars and percentage
- R-multiple (exit P&L ÷ initial risk)
- Outcome tag (full target, partial, stopped out, time exit)
Behavioral checkboxes:
- Plan followed? (Y/N)
- Emotion control? (Y/N)
- Size discipline? (Y/N)
Attribution:
- Signal ID
- Strategy label
- Market regime tag (trending, ranging, volatile)
- Reviewer notes
Example row:
| Field | Value |
|---|---|
| Date/Time | March 14, 2026, 9:45 AM |
| Instrument | SPY |
| Direction | Long |
| Entry / Stop / Target | $512.00 / $509.50 / $517.00 |
| Size / Risk | 100 shares / $250 (1% of $25,000) |
| Signal Tag | Opening range breakout |
| Conviction | 4/5 |
| Exit | $516.50 |
| P&L | +$450 / +1.8% |
| R-Multiple | +1.8R |
| Plan Followed | Y |
| Emotion Control | Y |
| Size Discipline | Y |
Structure your sheet so R-multiple, running win rate, running expectancy, and running drawdown are derived columns that auto-calculate. That way, every new row updates your live metrics without manual math.
The zinan92/journal project documents a practical decision-journal implementation that records the original signal and full execution context, then routes performance data back to signal scoring for monthly attribution reports.
Pro Tip: At entry, capture a screenshot of the chart plus a one-sentence note on overall market state and your current portfolio exposure. Accurate attribution is impossible without this context snapshot.
How to use your scorecard: daily, weekly, and monthly
Daily workflow
Log every trade at close, while the context is fresh. Run a five-minute end-of-day check: flag any behavioral checkbox that was not met and note why. Do not analyze trends daily — the sample is too small. The daily habit is about data quality, not conclusions.
Weekly quick checks
At the end of each trading week, review:
- Rolling win rate (last 20 trades)
- R-multiple distribution (are you hitting your avg R/R target?)
- Behavioral flag count (how many plan-adherence or sizing failures this week?)
If behavioral flags spike, that is the signal to slow down before the monthly review.
Monthly retrospective
This is where the scorecard pays off. Run through these steps in order:
- Aggregate core metrics — win rate, expectancy, profit factor, max drawdown for the month.
- Attribution by signal tag — group trades by signal ID and compute expectancy and hit rate per group. Which signals are positive expectancy? Which are dragging the composite down?
- Attribution by market regime — do your results differ in trending vs. ranging conditions?
- Identify top error types — rank behavioral failures by frequency (e.g., oversizing, early exits, trading outside your plan).
- Set one process target — pick the single highest-impact behavior to fix next month. One target, not five.
A decision journal that records the original signal and full execution context makes this attribution step reliable. Without the signal tag and market regime at entry, you are attributing results to memory rather than data.
For a deeper look at structuring monthly reviews, trading performance review best practices from Trader Gibkey cover what to include and how to cadence the process.
Why Eialgos Decision Intelligence scales your scorecard further
A manual spreadsheet works, but it has a ceiling. Eialgos maps directly to the scorecard workflow you just built, then automates the parts that are most prone to inconsistency.
The platform's six-factor analytical engine scores each trade setup before you enter, evaluating psychological and behavioral factors rather than generating a market signal. LIANA, the AI assistant, provides personalized feedback on your patterns over time — surfacing the behavioral errors your monthly retrospective would otherwise take hours to find.
Relevant features that map to the template fields above:
- Automated metric calculations: win rate, expectancy, R-multiple, and drawdown update in real time
- Behavioral scoring: pre-trade plan adherence and emotional control scored per trade
- Signal tagging and attribution engine: tag signals at entry, compare expectancy by signal group monthly
- Live trade management tools: position sizing checks and MAE tracking during the trade
- Options analysis: expiration, greeks, and assignment tracking for options traders
- LIANA assistant: monthly pattern detection and process feedback without manual aggregation
Eialgos offers a free tier to start, with paid upgrades that unlock advanced analytics, unlimited trade logging, and full attribution reporting. When evaluating any paid trading service, checking Trustpilot reviews and BBB profiles for user feedback and complaint histories is a sound due-diligence step.
Pro Tip: Use Eialgos's decision score as your pre-trade checklist replacement. If the score is low, treat that as a behavioral flag — not a veto, but a prompt to review your rationale before sizing up.
How to choose between a spreadsheet, a journal, and a Decision Intelligence platform
Three categories of tools exist for scorecard work. The right one depends on your trade volume, your need for automation, and how seriously you weight behavioral scoring.
Spreadsheet templates (free) Best for traders with fewer than 20 trades per month who want full control over their formula logic. You build it, you maintain it. The upside is flexibility; the downside is that behavioral scoring requires manual self-rating and the attribution step is time-consuming.
Dedicated trading journals ($0–$50/month) SaaS journals automate import from brokers and calculate core metrics automatically. They handle the quantitative layer well. Most offer limited behavioral scoring and no pre-trade decision scoring. Good for traders who want metric automation without a full platform commitment. For a comparison of journal features and audit-trail completeness, see Tradervue vs TraderSync.
Decision Intelligence platforms ($50–$250/month and up) Automated scoring, behavioral analytics, attribution engines, and AI-assisted feedback. Built for traders who treat process improvement as a serious practice. Eialgos sits in this category, with a free tier that lets you test the core decision-scoring workflow before committing to a paid plan.
A simple decision checklist:
- Do you trade more than 30 times per month? Automation saves meaningful time.
- Do you want behavioral scoring, not just P&L metrics? You need more than a journal.
- Is attribution by signal or strategy important to your review? A Decision Intelligence platform handles this natively.
- What is your budget? Start free, then upgrade when the data volume justifies it.
For a broader look at journal options before choosing, the best stock trading journal roundup covers the top picks ranked by feature set.
What to build and measure first: your immediate next steps
The goal is a working scorecard by end of week, not a perfect one by end of month.
- Today: Set up your template with the 12 core fields (date, instrument, direction, entry, stop, target, size, risk %, signal tag, exit, R-multiple, plan followed).
- This week: Log every trade. Do not skip the behavioral checkboxes — they are the data that makes the monthly retrospective useful.
- End of week one: Compute win rate and expectancy across your first sample. Do not draw conclusions yet; build the habit.
- End of month one: Run your first attribution by signal tag. Identify your highest-expectancy signal and your most common behavioral failure.
- Month two target: Set one process improvement goal based on the attribution. Measure whether the behavioral flag count drops.
Process consistency across many trades produces reliable data. A single great trade tells you nothing. A consistent process across 50 trades tells you everything.
The metric most traders ignore is the one that matters most
Most traders who build a scorecard focus almost entirely on win rate. It is the most visible number, the easiest to understand, and the most misleading. Expectancy, not win rate, is the number that tells you whether your edge is real.
The deeper problem is that traders treat their scorecard as a performance report rather than a behavioral audit. They compute the metrics, feel good or bad about the month, and change nothing. The monthly retrospective only works if it ends with one concrete process change — not five, not a general intention to "be more disciplined," but a single, measurable behavioral target.
Behavioral scoring is where most manual scorecards fall short. Self-rating emotional control at trade close is better than nothing, but it is subject to the same hindsight bias the scorecard is supposed to eliminate. A pre-trade decision score, computed before you enter, removes that bias entirely. That is the structural advantage of a Decision Intelligence platform over a spreadsheet: the score is generated before the outcome is known.
The conventional advice is to "track everything." The better advice is to track the right things consistently and act on one finding per month. A minimal scorecard maintained for six months produces more useful data than a comprehensive one abandoned after three weeks.
Eialgos scores your decisions before the trade, not after
Spreadsheets and journals tell you what happened. Eialgos tells you whether the decision was sound before you commit capital. The platform's six-factor analytical engine scores each setup on psychological and behavioral criteria, so your decision score is live at entry — not reconstructed from memory at month-end.
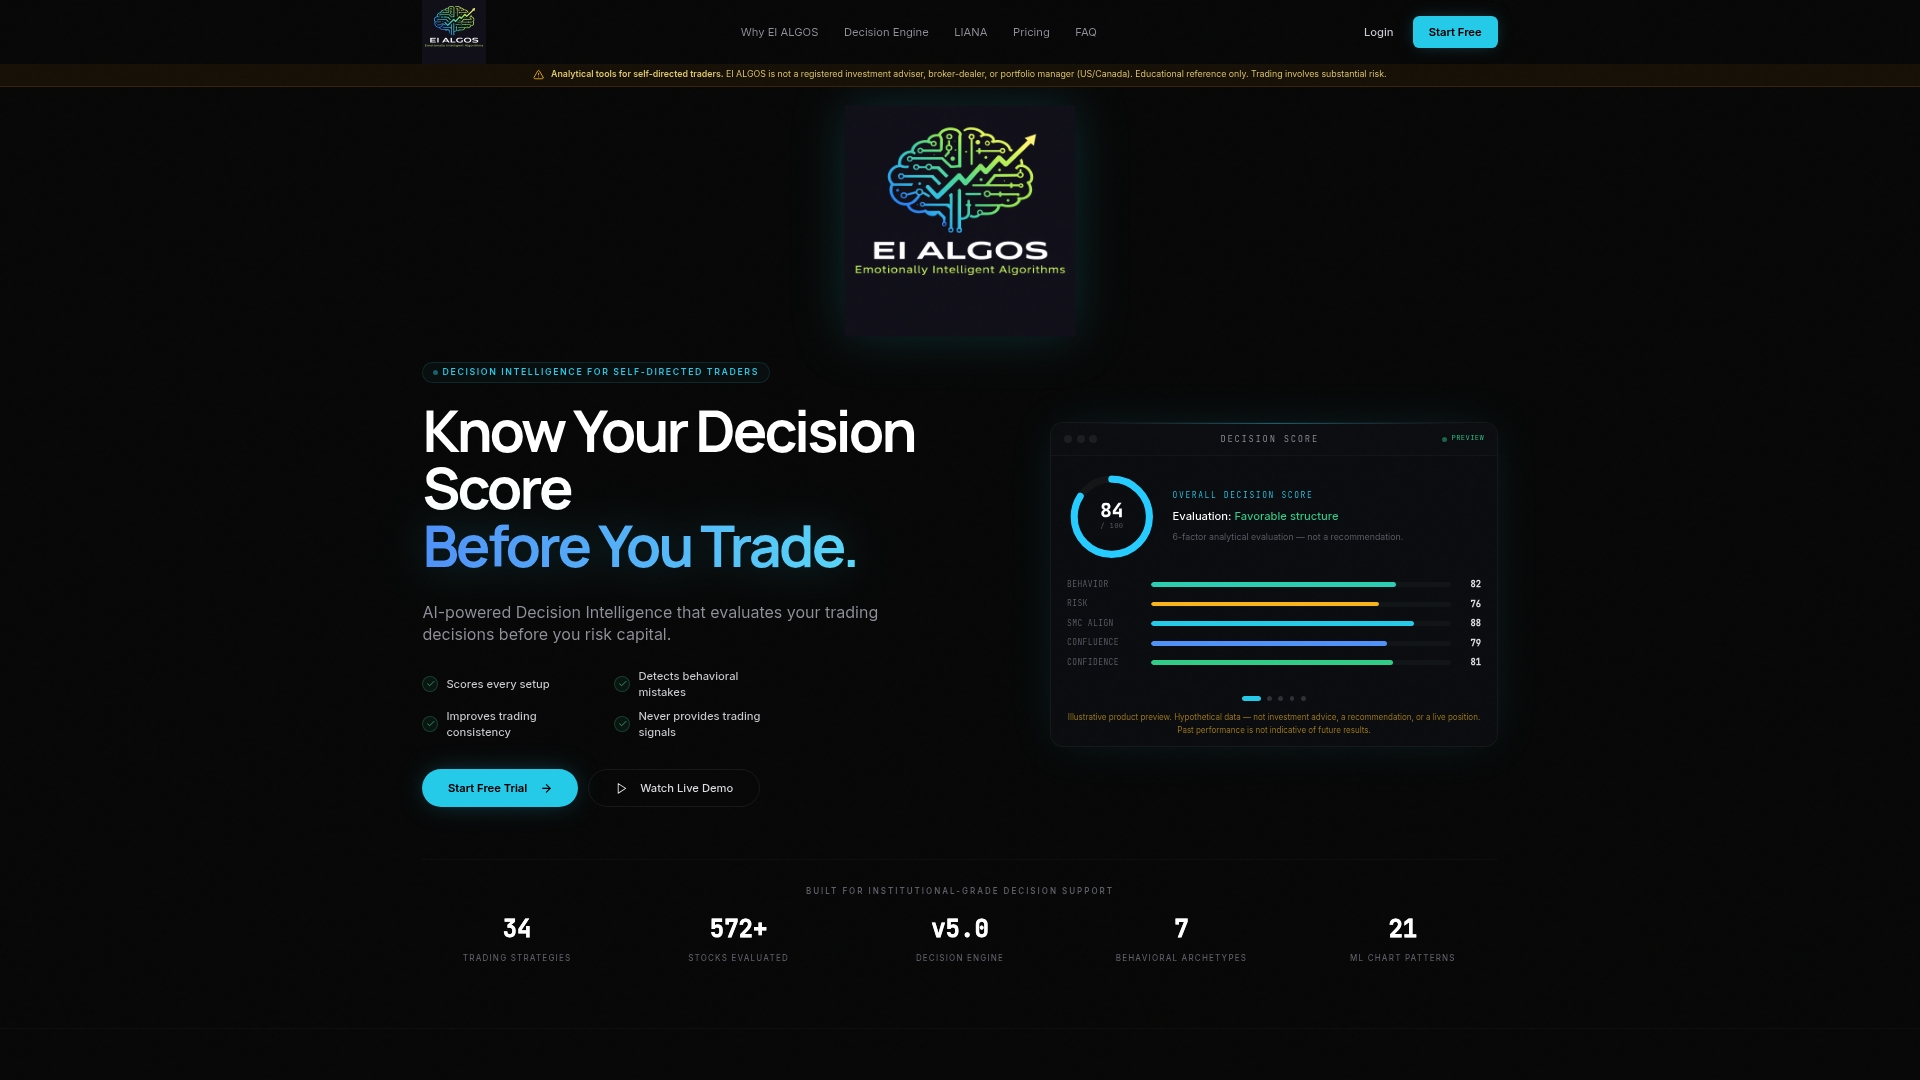
LIANA, the AI assistant, surfaces your behavioral patterns across your trade history and delivers personalized process feedback that a manual retrospective would take hours to produce. The free tier gets you started with core decision scoring. Paid plans unlock full attribution reporting, unlimited trade logging, and advanced behavioral analytics — the complete infrastructure for a trader who takes process seriously.
Start your free decision score on Eialgos today, or read the decision score guide to see exactly how the six-factor engine works before you sign up.
Sources
- Free Trade Review Scorecard | Nexural
- BullishBears Reviews | Read Customer Service Reviews of bullishbears.com
- TakeProfitTrader Profile | BBB