
Process-oriented trading is the discipline of judging every trade by your predefined decision rules and measurable execution quality, not by short-term P&L. The central question shifts from "Did I make money?" to "Did I follow my rules?" That single reframe changes everything about how you learn, improve, and stay consistent. EI ALGOS' six-factor analytical engine and LIANA assistant are built specifically to measure these elements so you can track them without relying on gut feel.
The five elements you must control on every trade:
- Entry criteria — did the setup meet every defined condition before you entered?
- Position sizing — did you apply your fixed sizing formula, no exceptions?
- Stop placement — was the stop set per your rules before the order was placed?
- Trade management — did you follow your scaling and exit logic, not your emotions?
- Post-trade grading — did you record setup type, entry grade, execution grade, and any rule violations?
Target a rule adherence rate of 90% or higher. Below that threshold, your P&L tells you almost nothing useful about your edge.
Table of Contents
- What process oriented trading really means statistically
- Why process focus reduces emotional volatility
- What your written trading process must include
- How to measure process adherence week by week
- Your 30/60/90-day roadmap to process-driven trading
- How EI ALGOS and LIANA make process scoring automatic
- Common behavioral mistakes and the rule-based fixes
- Your one-page checklist and journal template
- When you can realistically expect to see measurable improvement
- Key Takeaways
- The gap between knowing and actually doing it
- EI ALGOS scores your decisions so you can stop guessing at them
- Useful sources and further reading
What process oriented trading really means statistically
Most retail traders treat each trade as a binary event: win or loss, right or wrong. Process-driven trading treats each trade as a single data point in a distribution. Your edge only shows up across a sample, not in any one outcome.
Here is the clearest example of why this matters. You take a trade that checks every box on your checklist. It loses. A process-focused trader grades that trade as a success because the decision was correct. An outcome-focused trader feels like they failed and starts second-guessing the system. That second-guessing is where real edge erosion begins.
- Process metrics are leading indicators — rule adherence, execution quality, and risk compliance show you where discipline is slipping before P&L confirms it.
- P&L is a lagging indicator — by the time your account reflects a behavioral problem, the damage is already done.
- Expectancy only becomes readable with sample size — you need enough process-compliant trades to separate skill from variance.
Treat every trade as a data point in a statistical distribution, not a verdict on your ability.
Why process focus reduces emotional volatility
The psychological shift here is concrete, not abstract. When you judge decisions instead of outcomes, you remove the emotional charge from random variance. A losing streak no longer means you are doing something wrong. A winning streak no longer means you can loosen the rules.
Shifting focus from outcome to process reduces emotional reactivity and creates a consistent feedback loop for improvement. Overtrading, revenge trades, and size escalation after losses all share the same root cause: outcome-based self-evaluation. Fix the evaluation standard and you fix the behavior.
- Reduced emotional reactivity after losses
- Fewer impulsive entries driven by fear of missing out
- Cleaner post-trade reviews because you are grading decisions, not defending your ego
Pro Tip: Run separate review sessions for process analysis and outcome analysis. During process reviews, hide your P&L column entirely. Conflating the two is the fastest way to let a bad week corrupt an otherwise sound process evaluation.
What your written trading process must include

A process only works if it is written down before you trade. Verbal commitments dissolve under pressure. Here is the full checklist of what belongs in your documented system:
Pre-market routine
- Market regime check (trending, ranging, high-volatility)
- Liquidity and volatility filters (avoid low-volume opens, news windows)
- Daily bias confirmation (are conditions aligned with your strategy type?)
Trade identification and entry criteria
- Signal definition (exact conditions that qualify a setup)
- Confirmation rules (minimum number of confluences required)
- Entry trigger (specific price action or indicator threshold)
Position sizing and risk rules
- Per-trade risk as a fixed percentage of account
- Maximum daily drawdown limit before trading stops
- Scaling rules (when and by how much you add to a position)
Execution rules
- Order type specified in advance (limit vs. market)
- Maximum acceptable slippage before canceling
- Stop placement method (ATR-based, structure-based, or fixed)
Trade management and exit rules
- First target and partial exit size
- Trailing logic (when it activates and how it moves)
- Invalidation condition (what price action cancels the thesis)
Journaling fields required for process scoring
- Setup type, entry grade (A/B/C), execution grade, management grade
- Rule violations list (specific, not vague)
- Outcome recorded separately in R-multiples
How to measure process adherence week by week
| KPI | Formula | Target |
|---|---|---|
| Rule adherence rate | Compliant trades ÷ total trades | 90%+ |
| Risk compliance | Trades within risk limit ÷ total trades | 95%+ |
| Override count | Number of rule violations per week | Trending very low |
| Execution quality | Planned entry price vs. actual fill | Within slippage tolerance |
| Trade quality score | Average of entry + management + exit grades | B or higher |
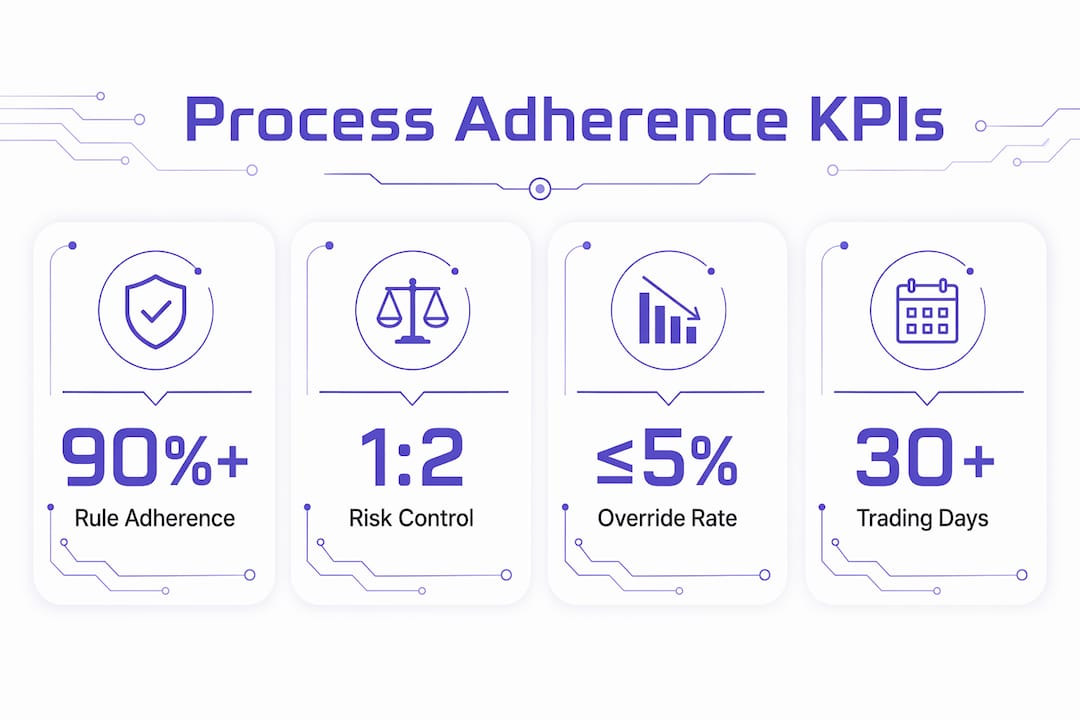
Worked example: You take 20 trades in a week. Eighteen follow every rule. Two were entered without full confirmation. Adherence rate = 18 ÷ 20 = 90%. You are at the minimum threshold. The goal is to understand which setup type generated the violations, not just count them.
Pro Tip: Hide your P&L during process reviews. Seeing a green week makes traders rationalize violations; seeing a red week makes them over-correct. Grade the process first, then look at the numbers.
"Process metrics act as leading indicators while P&L is a lagging indicator — low adherence signals a discipline problem before the account balance confirms it." — NexusFi Academy
Your 30/60/90-day roadmap to process-driven trading
Days 1–30: Document and score everything
- Write your complete trading process in a single document.
- Score every trade using the journal fields above, no exceptions.
- Implement your pre-market checklist as a daily non-negotiable.
- Track your adherence rate weekly. Do not adjust rules yet.
- Weekly checkpoint: Is your adherence rate above 80%? If not, identify the top two violation types.
Days 31–60: Stabilize and fix mechanics
- Address the two most common violation patterns from month one.
- Tighten execution mechanics (slippage, order type discipline).
- Set documented drawdown protocols: reduce size at 1% daily loss, pause at 2%, extended break at 3%.
- Run your first full weekly process audit.
- Weekly checkpoint: Is risk compliance above 95%? Are override counts declining?
Days 61–90: Validate and refine
- Calculate expectancy on process-compliant trades only.
- Compare compliant vs. non-compliant trade outcomes to quantify the cost of violations.
- Refine one rule per month based on process data, not P&L emotion.
Pro Tip: Do not scale position size until adherence is above 90% for at least 30 consecutive trading days. Scaling a broken process just amplifies the damage.
How EI ALGOS and LIANA make process scoring automatic
EI ALGOS is built on a single premise: traders improve faster when they get scored on decisions, not outcomes. The platform's six-factor analytical engine evaluates each trade setup across behavioral and execution dimensions, including setup quality, risk alignment, timing, and decision consistency. No signals. No recommendations. Just a clear score on whether your decision met your own defined criteria.
LIANA, the platform's AI assistant, goes further. She detects behavioral patterns across your trade history, flags specific violation types (position creep, early exits, oversizing after wins), and delivers personalized feedback tied to your actual trading data. If you are overtrading on Fridays or abandoning stops during volatile opens, LIANA identifies it before your account does.
- Six-factor scoring covers the full decision lifecycle, not just entry.
- Behavioral diagnostics surface patterns invisible to manual journaling.
- Personalized nudges from LIANA reinforce process adherence in real time.
- No signal dependency means you build your own edge, not someone else's.
"The goal is disciplined execution of a predefined system. Every trade is a data point, not a verdict." — SteadyOptions
Common behavioral mistakes and the rule-based fixes
Traders often confuse short-term luck with process quality. A bad process with good short-term outcomes is the most dangerous state in trading because it reinforces exactly the wrong behavior.
- Overtrading → Set a maximum daily trade count. When you hit it, the session ends.
- Position creep → Enforce a fixed sizing formula with no discretionary override allowed.
- Revenge trading → Trigger your 2% drawdown protocol automatically; no manual override.
- Early exits → Require a written invalidation reason before closing a trade ahead of target.
- Skipping the checklist → No checklist completion, no trade entry. Non-negotiable.
Log every override with a specific reason in your journal. Require yourself to write one sentence explaining why you broke the rule. Vague entries ("felt wrong") are not acceptable. That friction alone reduces impulsive violations.
Pro Tip: Set a time-based alert at 30 minutes before your session ends. Review your override count before placing any more trades. Frequency-based alerts catch pattern drift before P&L does.
Your one-page checklist and journal template
Pre-market checklist (pass/fail)
- Market regime identified (trending / ranging / avoid)
- Volatility filter checked (within acceptable range)
- Daily bias confirmed
- Max daily risk limit set
- Checklist complete → cleared to trade
Per-trade journal template
- Date and time
- Setup type (name your pattern)
- Entry criteria met? (Yes / No / Partial)
- Entry grade (A / B / C)
- Position size (% of account)
- Stop placement method
- Management grade (A / B / C)
- Exit grade (A / B / C)
- Rule violations (list specifically or write "None")
- Outcome in R-multiples (record last, after grading)
Daily review checklist
| Task | Done? |
|---|---|
| All trades graded | ☐ |
| Override count logged | ☐ |
| Weekly adherence rate calculated | ☐ |
| Violation patterns noted | ☐ |
| P&L reviewed separately | ☐ |
When you can realistically expect to see measurable improvement
Process metrics will show improvement weeks before P&L reflects it. That gap is not a problem. It is the leading indicator doing its job.
- Intraday scalpers (10+ trades per day): meaningful process data within 2–3 weeks; expectancy readable around 50 trades.
- Swing traders (3–10 trades per week): allow 6–8 weeks before drawing conclusions; target 50–100 process-compliant trades.
- Options traders (lower frequency): 90–120 days minimum; 50–200 trades depending on strategy type.
Do not change your rules based on fewer than 50 compliant trades. The variance at that sample size is too high to distinguish edge from noise. Premature rule changes are one of the most common ways traders destroy a system that was actually working.
Key Takeaways
Process-oriented trading works because it gives you a feedback loop you actually control: score decisions, not outcomes, and your improvement becomes measurable before your P&L confirms it.
| Point | Details |
|---|---|
| Judge decisions, not outcomes | Ask "Did I follow my rules?" on every trade, targeting 90%+ adherence rate. |
| Process metrics lead P&L | Rule adherence and risk compliance (target 95%+) signal problems weeks before losses appear. |
| Use a written process | Document entry criteria, sizing, stops, management rules, and journal fields before trading. |
| Follow the 30/60/90 roadmap | Document in month one, stabilize in month two, validate expectancy in month three. |
| EI ALGOS + LIANA | The six-factor engine and LIANA assistant score your decisions and surface behavioral patterns automatically. |
The gap between knowing and actually doing it
Most traders understand process orientation intellectually within about ten minutes of reading about it. The hard part is not the concept. It is sitting in front of a live position, watching it move against you, and not overriding your stop because "this one feels different."
What actually separates traders who adopt this approach from those who talk about it is the feedback loop. Without a scoring system, you are relying on memory and self-assessment, both of which are heavily distorted by recency and outcome bias. The traders who make this shift stick are the ones who externalize the grading, whether through a rigorous journal, a structured audit process, or a platform that does the scoring for them.
One caution worth stating plainly: adopting a process does not guarantee short-term profitability. A well-followed process on a flawed strategy still loses money. The process tells you whether your execution is the problem or your edge is. That distinction takes time and sample size to resolve. Do not mistake process compliance for a profit guarantee. Use it as the diagnostic it is.
EI ALGOS scores your decisions so you can stop guessing at them
Most journaling tools record what happened. EI ALGOS scores why it happened and whether the decision was sound before the outcome was known. That is the practical difference between a trade log and a Decision Intelligence platform.
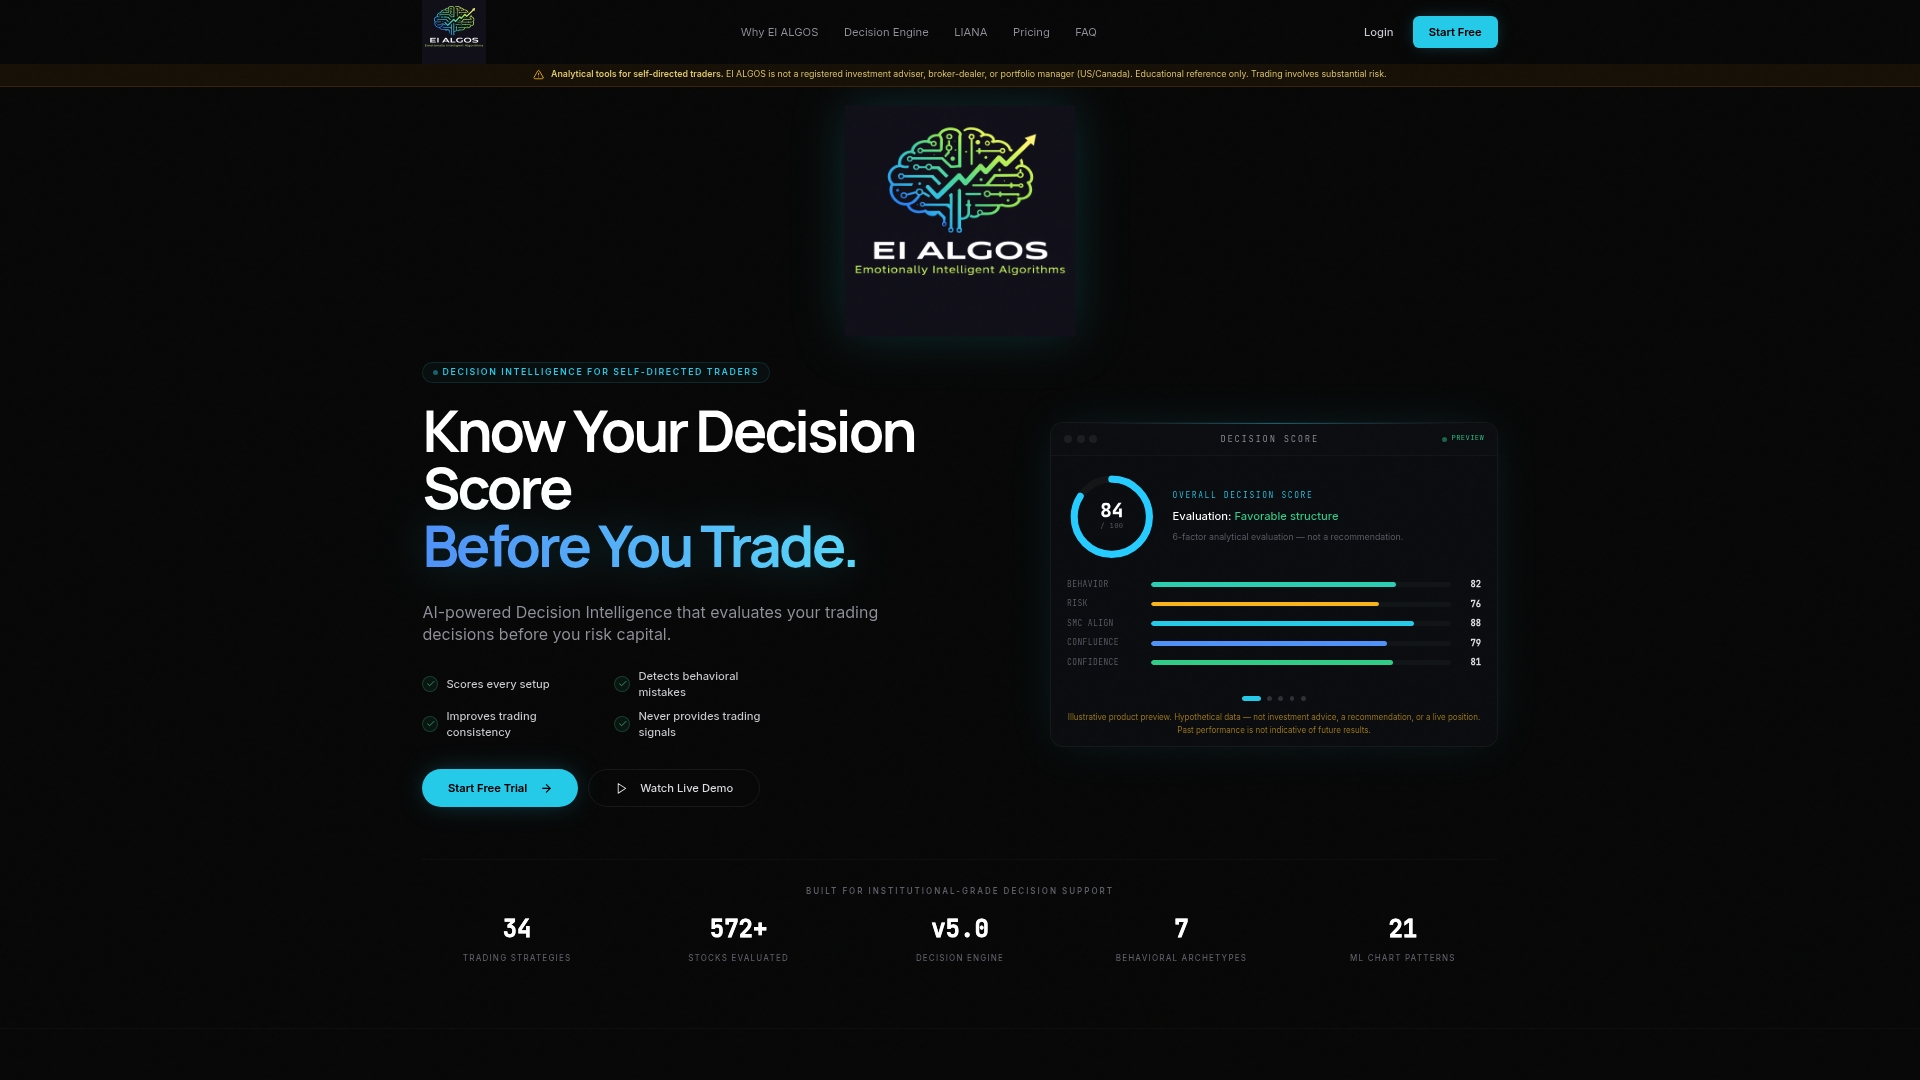
The six-factor analytical engine evaluates every setup on behavioral and execution dimensions. LIANA delivers personalized diagnostics tied to your specific violation patterns, not generic advice. There are no signals, no recommendations, and no dependency on someone else's calls. You build your own process. The platform measures whether you are actually following it.
EI ALGOS offers a free tier so you can test the scoring system on your own trades before committing to a paid plan. Paid tiers unlock unlimited usage, advanced behavioral diagnostics, and full LIANA assistant access. Start with the free Decision Intelligence platform and run your next ten trades through the six-factor engine. The score on trade one will tell you more than a month of outcome-only journaling.
Useful sources and further reading
The following sources informed the KPI benchmarks, psychological rationale, and process frameworks in this article:
- Process-Focused Trading: Why What You Control Matters More Than What You Make — NexusFi Academy. Primary source for adherence rate targets (90%+), risk compliance benchmarks (95%+), drawdown protocol structure, and the weekly audit framework.
- Process Driven Crypto Trading — Thrive. Source for the psychological rationale behind process focus and the separate-sessions review method.
- Focus on the Process, not the Outcome — SteadyOptions. Source for the statistical mindset, the process/outcome matrix, and minimum sample-size guidance.
- EI ALGOS Decision Intelligence Platform — product details on the six-factor analytical engine, LIANA assistant, and subscription tiers.
Save the one-page checklist from the template section above and bookmark the EI ALGOS platform for process-scoring demos. The checklist works immediately; the platform scales with you as your sample size grows.