
Yes, you can trade without signals. The reliable path runs through a rules-based price-action process, strict risk control, and disciplined practice, not a subscription to someone else's chart calls. It demands more of you upfront: reading raw price movement, building repeatable entry and exit rules, and sizing positions by percent risk rather than gut feel. The trade-off is real. The learning curve is steeper, and the discipline has to come from inside your own process instead of a signal provider's track record.
TL;DR:
- Trading without signals relies on reading raw price movement, structure, and volume, which demands more discipline and understanding from the trader.
- This approach is most effective in liquid, trending markets on higher timeframes and with instruments that exhibit consistent behavior.
- Key setups include trend-following pullbacks and range rejections, both of which require clear structural zones and candlestick triggers confirmed across multiple timeframes.
- Building a rules-based process with specific checkpoints and strict risk limits is essential to preventing emotional decisions and maintaining discipline.
- Transitioning from signal reliance to independent trading takes at least six weeks, emphasizing observation, demo practice, and gradual size increase with proper journaling.
Table of Contents
- What Does Trading Without Indicators Actually Mean?
- Core Price Action Setups You Can Practice Today
- How Do You Build a Rules-Based Trading Process?
- Why Risk Management Matters More Without Signals
- How Long Does It Take to Transition Away From Signals?
- How Eialgos Supports Independent, Process-Driven Trading
- When Indicator-Free Trading Makes Sense and When It Doesn't
- Let Eialgos Score the Setups You Used to Outsource
- Sources
What Does Trading Without Indicators Actually Mean?
Trading without signals means making entry and exit decisions from raw price movement, market structure, and volume, instead of waiting for an alert, a moving-average crossover, or someone else's trade call. Traders who work this way read candlesticks, support and resistance zones, and swing structure directly off a naked chart. Price-action trading treats candlestick behavior and market structure as the primary data, not as a derivative of it.
Every popular indicator, from RSI to MACD to Bollinger Bands, is a mathematical transformation of past price. That transformation always lags. By the time a moving-average crossover confirms a trend, price has often already moved through the bulk of that move. Reading price directly cuts out that lag and forces you to interpret what the market is actually doing right now, not what a formula concluded five candles ago.
Volume adds a second layer of confirmation where it's available. A breakout on heavy volume carries more conviction than the same breakout on thin volume, and low-volume breakouts are more likely to fail. In markets where volume data isn't reliable, spot forex being the classic example, you lean harder on price structure and multi-timeframe confluence instead.
This approach tends to suit certain conditions better than others:
- Liquid, trending markets where structure is clean and swings are well-defined, rather than choppy, news-driven chop.
- Higher timeframes (four-hour and daily charts) where noise is filtered out and patterns hold more weight.
- Traders with time to observe price behavior across sessions, since pattern recognition builds through repetition, not shortcuts.
- Instruments with consistent behavior, such as major indices or liquid forex pairs, over thinly traded small caps prone to erratic wicks.
If you're trading five-minute charts on illiquid instruments hoping for clean price action, you're fighting the method's own conditions for success.
Core Price Action Setups You Can Practice Today
Three building blocks make up almost every indicator-free strategy: market structure, support and resistance zones, and candlestick triggers. Layer a multi-timeframe workflow on top of these, and you have a complete, repeatable system.
Market structure is the sequence of swing highs and swing lows. An uptrend prints higher highs and higher lows; a downtrend prints lower highs and lower lows. When that sequence breaks, structure has shifted, and that shift is often the first objective clue that a trend is losing momentum before any indicator would confirm it.

Support and resistance work better as zones than as exact lines. Price rarely respects a single value to the tick. Draw a band around the cluster of highs or lows where reactions occurred, and treat the whole zone as the level. A single-wick extreme, without confirmation from a higher timeframe, is not a validated zone worth trading against.
Candlestick triggers give you the timing. A pin bar rejecting a support zone, a bullish engulfing candle at the bottom of a pullback, or an inside bar coiling before a breakout, each tells you something about who won the fight between buyers and sellers at that specific level. They matter most when they occur at a pre-identified structural level, not in the middle of nowhere.
The workflow that ties it together: set your directional bias on a higher timeframe (daily or four-hour), then drop to a lower timeframe (one-hour or fifteen-minute) to time the actual entry. This top-down multi-timeframe method keeps you trading with the dominant trend while still getting a tight, low-risk entry point.
Two setups worth practicing first:
- Trend-following pullback. Identify an uptrend on the daily chart, wait for price to pull back into a prior support zone, then look for a bullish engulfing candle on the one-hour chart. Enter on the close of that candle, place your stop below the zone's low, and target the prior swing high.
- Range rejection. Mark the top and bottom of a clear trading range, wait for a pin bar or a false break back inside the range at either boundary, then enter in the direction of the rejection with a stop just beyond the wick and a target at the opposite side of the range.
Pro Tip: Before you take any setup live, mark it up on a printed or screenshotted chart and write one sentence explaining why the zone and trigger justified the trade. If you can't write that sentence clearly, you don't understand the setup well enough to risk money on it.
How Do You Build a Rules-Based Trading Process?
A trade idea without a written rule set is a guess with extra steps. Turning price-action reading into a mechanical process is what separates traders who survive from traders who blow up on their best idea of the year.
Build your trade plan around five checkpoints, in order:
- Setup. Confirm the higher-timeframe bias and identify a valid structural zone (support, resistance, or a trend line respected at least twice).
- Trigger. Wait for a specific candlestick signal at that zone. No trigger, no trade, regardless of how good the setup looks.
- Stop. Place your stop at a structurally logical point, just beyond the zone or the trigger candle's extreme, before you calculate anything else.
- Target. Define your take-profit level using the next structural level or a fixed reward-to-risk ratio, decided before entry, not adjusted after.
- Size. Calculate position size from the distance between entry and stop, not from a flat lot size you use on every trade.
Position sizing math is simple once you commit to it. For example, you determine a fixed dollar risk per trade and calculate your position size based on the difference between your entry and stop levels. This means your dollar risk remains constant while share count adjusts with volatility.
Exits deserve the same rigor as entries. Three approaches work well:
- Fixed reward-to-risk. Set a 2:1 or 3:1 target relative to your stop distance and take it mechanically when hit.
- Structure-based exits. Close the trade when price breaks the swing structure that justified the entry, even if your fixed target hasn't been reached.
- Scaling out. Take partial profit at a first structural level, then let the remainder run with a trailing stop tied to new swing points.
Writing these rules down in advance, and following them without exception, is what makes the difference between a rules-based process and a series of emotional bets that happen to use price-action vocabulary.
Why Risk Management Matters More Without Signals
Without a signal provider absorbing some of the decision load, every risk decision sits on your shoulders. That's the point of the approach, but it also means the guardrails have to be non-negotiable.
Set hard limits before you place a single trade:
- Per-trade risk capped at 1 to 2% of account equity, a rule repeated across practical price-action guides for good reason.
- Daily loss limit that shuts down trading for the day once hit, no exceptions and no "one more trade to get it back."
- Weekly drawdown cap, often 5 to 6%, that forces a full review of your process before you resume.
- Maximum concurrent exposure, so five correlated positions don't quietly turn into one oversized bet.
Stop discipline carries more weight here than in signal-based trading, because there's no external checkpoint reminding you the setup has failed. If you move a stop because "it just needs a bit more room," you've abandoned the process that made the trade valid in the first place.
Two biases show up constantly in traders working without signals: chasing price after missing an entry, and revenge trading after a loss. Both are countered the same way, through written rules and a trade journal that forces you to confront the pattern in your own history rather than rationalize it in the moment.
Pro Tip: Build a two-question pre-trade checklist: "Does this match a setup I've written down?" and "Am I trading this because of the chart, or because of my last trade?" If the honest answer to the second question is the latter, close the platform for thirty minutes.

How Long Does It Take to Transition Away From Signals?
A six-to-eight-week staged plan works better than an abrupt switch, because it lets pattern recognition build gradually while your risk stays small.
- Weeks 1 to 2, observe only. Study price action on your usual charts with indicators still visible, but make no trades. Just annotate structure, zones, and triggers as they form.
- Weeks 3 to 4, demo with rules. Remove indicators on a demo account and trade your written setups. This phased removal keeps decision quality from collapsing all at once.
- Weeks 5 to 6, small live size. Move to live trading at minimum size, journaling every trade with a screenshot, rationale, and outcome, the core feedback loop for improving pattern recognition.
- Weeks 7 to 8, scale gradually. Increase size only after your journal shows consistent rule adherence, not just a winning streak.
Track win rate, expectancy per trade, and rule adherence rate as your checkpoints, not just account balance. If false breaks keep stopping you out during transition, a hybrid approach, keeping one long-term moving average purely for context, is a reasonable bridge rather than a failure of the method.
How Eialgos Supports Independent, Process-Driven Trading
Removing signals from your process doesn't mean removing feedback. Eialgos evaluates the decision behind each setup using a six-factor analytical engine that scores process quality, not price direction, covering how well a trade matches your plan, your risk sizing, and your own behavioral history at similar setups.
The goal isn't another forecast. It's a mirror that shows you where your own process breaks down, before the market shows you in your account balance.
The LIANA assistant reviews your scored trades and surfaces personalized feedback, flagging recurring behavioral errors like oversized entries after a loss or setups taken outside your written rules. That kind of consistent scoring is what enforces the discipline this whole framework depends on, especially once you're the only one deciding whether a trade qualifies. Reviewing how to score a trade before you click shows how that evaluation fits into a daily routine.
When Indicator-Free Trading Makes Sense and When It Doesn't
Indicator-free trading suits traders with the time to log hundreds of chart hours and the temperament to sit through a losing streak without abandoning their rules. It doesn't suit someone trading part-time between meetings, checking charts twice a day and expecting naked-chart precision on a five-minute timeframe.
A hybrid approach is often wiser during the first few months. Keep one long-term moving average purely for trend context, as some traders do to reduce false breaks, while you build genuine structure-reading skill underneath it.
My own rule on a naked chart is simple: I want two confirmations, a structural zone and a candlestick trigger, before I care about a setup at all. Everything else is noise until those two align.
— Anantha
Let Eialgos Score the Setups You Used to Outsource
Once you've stopped waiting on outside signals, the next question is whether your own setups actually hold up. Eialgos was built for exactly that gap: it scores each trade against a six-factor behavioral engine instead of handing you another forecast, so you get an honest read on your process, not a prediction to lean on.
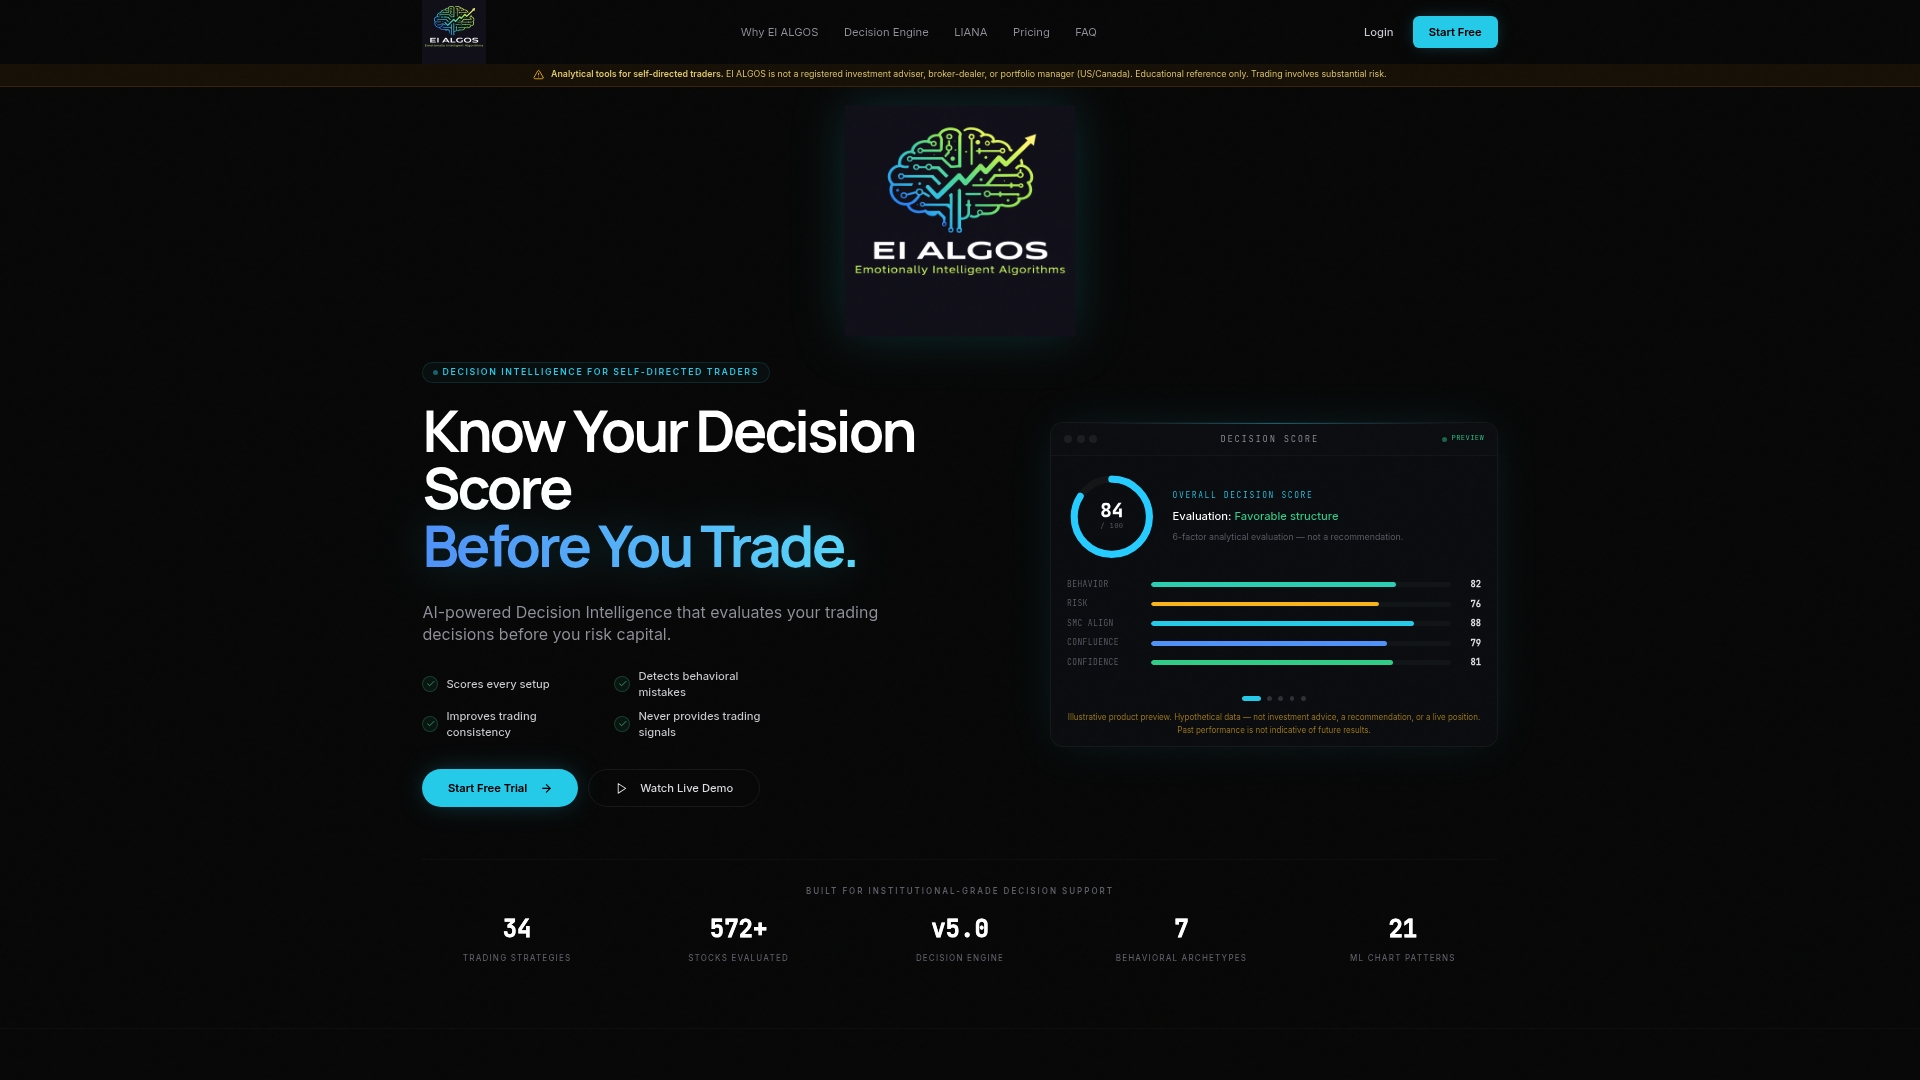
The free tier lets you score your first setups without a commitment, and the Knowledge Hub walks through the behavioral framework behind the scoring if you want the mechanics before you dive in. Traders further along can compare subscription tiers for unlimited scoring and full access to LIANA's personalized feedback. Start with a few trades in the free tier and see what the scoring reveals about your own patterns before you decide whether to upgrade.
Sources
For deeper study, see the practical guide to naked-chart trading and Eialgos's own guides: why signals fail, process-oriented trading, and practical risk management rules.
- Trading Without Indicators: Pure Price Action - Forex Wink
- Price Action Trading Without Indicators — Traders Agency
- Pure Price Action Trading: A Practical Guide to Naked Charts