
A false breakout is a price move beyond a support or resistance level that fails to hold and closes back inside the prior range. When you see a breakout bar print, don't buy the wick. Wait for a close beyond the level, and look for volume or momentum confirmation before you commit capital.
Run this immediate-action checklist the moment a breakout candle forms:
- Don't chase the first tick through the level.
- Do wait for the candle to close beyond the level, not just poke through it.
- Do check if volume confirms the move or looks thin and suspicious.
Pro Tip: Score the bar fast: volume, close location, and distance from the level. Two or three green flags means wait for a retest. Zero or one means the break is probably a trap worth fading.
Key Takeaways
False breakouts fail most often on low timeframes, and volume plus a confirmed close beyond the level are the two filters that separate tradable breaks from traps.
| Point | Details |
|---|---|
| Never buy the wick | Wait for a candle close beyond the level before entering any breakout. |
| Volume is the tie-breaker | Require roughly 1.5 to 2 times average volume on the breakout bar for confirmation. |
| Timeframe changes odds | Daily breakouts fail far less often than 1-minute or 5-minute breaks. |
| Fade with defined risk | Failed-structure entries offer a clear stop beyond the breakout extreme. |
| Score before you size | A zero-to-five checklist score should set both your entry decision and position size. |
Table of Contents
- What Is a False Breakout in Trading and Why It Matters
- Common False-Breakout Patterns You'll See on Charts
- How Do You Confirm a Breakout Is Real?
- Three Trade Plans for Trading a False Breakout
- Risk Management and Backtesting Your False-Breakout Edge
- Using a Six-Factor Score to Cut False-Breakout Errors
- Trading False Breakouts: What Actually Moves the Needle
- Sources
What Is a False Breakout in Trading and Why It Matters
A false breakout happens when price violates a support or resistance level, then reverses and closes back inside the prior range, often within a handful of bars. The mechanical tell is the close, not the wick. A candle can pierce a level by several ticks and still close well inside it, which is your first clue the move lacked real force.
This distinction changes outcomes directly. Traders who buy every breakout without filters absorb a high failure rate, and that failure rate is steeper on lower timeframes, where noise dominates. Getting this wrong inflates drawdown and turns a positive-expectancy strategy into a coin flip. Consider a simple range: price pokes above resistance, prints one bullish bar, then closes back under the level within three candles. That's the pattern in miniature.
A break that closes back inside the range within a few bars is usually a liquidity grab, not the start of a new trend. The close tells you more than the wick ever will.
Common False-Breakout Patterns You'll See on Charts
Certain false-breakout patterns show up again and again once you know what to look for:
- Fakey (inside-bar false break): price breaks out of an inside bar, then snaps back through the mother bar. The clue is a quick reversal candle engulfing the breakout attempt.
- Pin bar rejection: a long wick punches through a level and closes near the opposite end, showing rejection in a single candle.
- Wick-through stop run: price spikes just past a well-known level to trigger stops, then reverses almost immediately with no follow-through volume.
- Range probe with quick reclaim: price tests the edge of a range, fails to attract new buyers or sellers, and slides back inside within one or two bars.
Pro Tip: Pin bar rejections and stop runs are more reliable in range-bound markets. Fakeys near a strong trend often resolve as continuation, not reversal, so check the higher-timeframe structure first.
How Do You Confirm a Breakout Is Real?
Run this checklist the moment a bar closes beyond a level, before you touch the order ticket:
- Volume multiple. Compare the breakout bar's volume to the 20-period average. Breaks under roughly 1.5 to 2 times average volume fail far more often.
- Close location. Did the candle close beyond the level, or just wick through it and close back inside?
- ATR distance. Measure how far the close sits beyond the level relative to the Average True Range. A break that barely clears the level by a fraction of ATR carries less conviction.
- Retest behavior. Does price come back to retest the broken level and hold, or does it immediately reclaim the other side?
- Momentum divergence. Check RSI or Stochastic against price. If price makes a new high on the breakout but momentum doesn't confirm it, treat the move with suspicion.
Timeframe matters enormously here. Intraday failure rates run roughly 68 to 72% on one-minute charts, 60 to 65% on five-minute charts, 55 to 60% on fifteen-minute charts, around 50% on hourly charts, and 40 to 45% on daily charts. A daily close beyond resistance carries far more weight than a five-minute poke above the same level.
Picture a confirmed breakout: price closes beyond resistance on volume 2.3 times average, momentum makes a matching new high, and the retest holds above the old level. A false one looks different: a thin-volume wick, a close back inside the range, and RSI already rolling over before the "breakout" even printed.
Three Trade Plans for Trading a False Breakout
Test these three setups on your own instrument and timeframe before risking real size.
1. Filtered live-break entry. Enter on the close of the breakout bar only if volume exceeds 1.5 times the 20-period average and the close sits beyond the level by at least 0.5 ATR. Stop goes just inside the broken level, on the opposite side of the breakout candle's midpoint. Target the next structural swing point, or scale out at 1R and let the rest run.
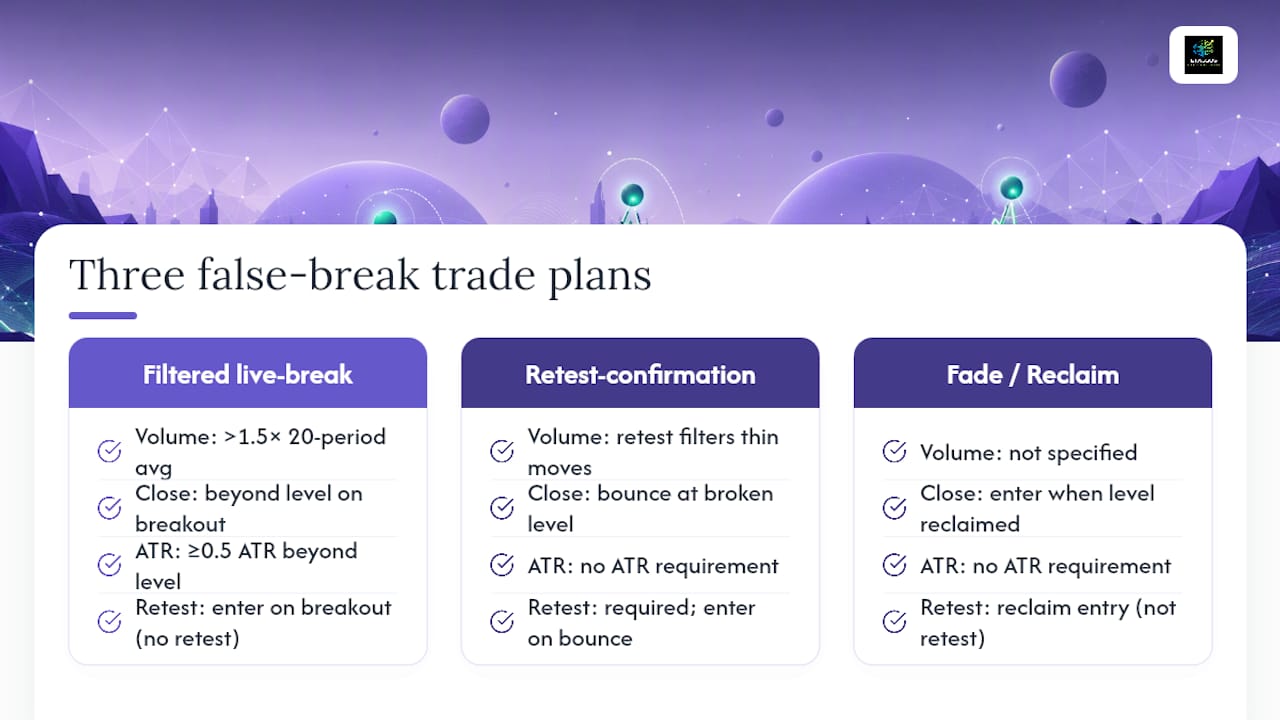
2. Retest-confirmation entry. Skip the initial break entirely. Wait for price to pull back to the broken level and hold, then enter on the bounce. Stop sits beyond the retest low (or high, for short setups). This sacrifices some early winners but meaningfully improves entry quality by filtering out thin, stop-hunt moves.
3. Fade/failed-structure entry. When price reclaims a broken level, enter in the direction of the reclaim, using trapped breakout traders' stop-outs as reversal fuel. Stop goes just beyond the failed breakout's extreme wick. Target the opposite side of the range or prior support/resistance. This setup offers a tight, clearly defined invalidation point and strong risk-reward in range-bound conditions.
Before sending any order, score the setup zero to five across volume, close location, ATR distance, retest, and momentum. Four or five means take it live. Two or three means wait for the retest. Zero or one means fade it or skip it entirely.
Realistic fills matter more than most traders admit. Spreads and slippage on fast fakeout reversals can eat a full R of expected profit on thin instruments, so backtest with conservative fill assumptions, not theoretical mid-price entries.
Risk Management and Backtesting Your False-Breakout Edge
Before trading this live, backtest it properly. Pull a sample of at least 100 to 200 signals across multiple months, segmented by session (London, New York, Asia) and time of day, since fakeout frequency shifts with liquidity.
Track these metrics for every trade in your journal:
- Win rate and average risk-to-reward ratio
- Trade expectancy (win rate times average win, minus loss rate times average loss)
- Maximum drawdown in a single day
- Longest streak of consecutive losers
- Total trade frequency per week
| Timeframe | Approximate Failure Rate |
|---|---|
| 1-minute | 68–72% |
| 5-minute | 60–65% |
| fifteen-minute | 55–60% |
| Hourly | ~50% |
| Daily | 40–45% |
Watch for look-ahead bias (using data you wouldn't have had in real time) and ignoring execution costs. Both inflate backtest results and set you up for a rude surprise live.
Using a Six-Factor Score to Cut False-Breakout Errors
Manual checklists work, but they drift under pressure. A structured scoring workflow turns judgment calls into numbers you can review later. Score each setup zero or one across six factors:
- Level context: is this a well-tested, significant level or a minor one?
- Volume multiplier: does volume clear your threshold?
- Close location: did the candle close beyond the level?
- ATR distance: is the break meaningful relative to recent volatility?
- Momentum alignment: does RSI or Stochastic agree with price?
- Retest behavior: did a retest hold, or reclaim immediately?
A setup scoring five or six is a live take. Three or four means wait for the retest. Two or below flips it to a fade candidate, and your position size should shrink to match. EI ALGOS builds this kind of six-factor scoring into a platform workflow, with the LIANA assistant flagging behavioral errors as you trade, for readers who want this process automated rather than tracked by hand.
Trading False Breakouts: What Actually Moves the Needle
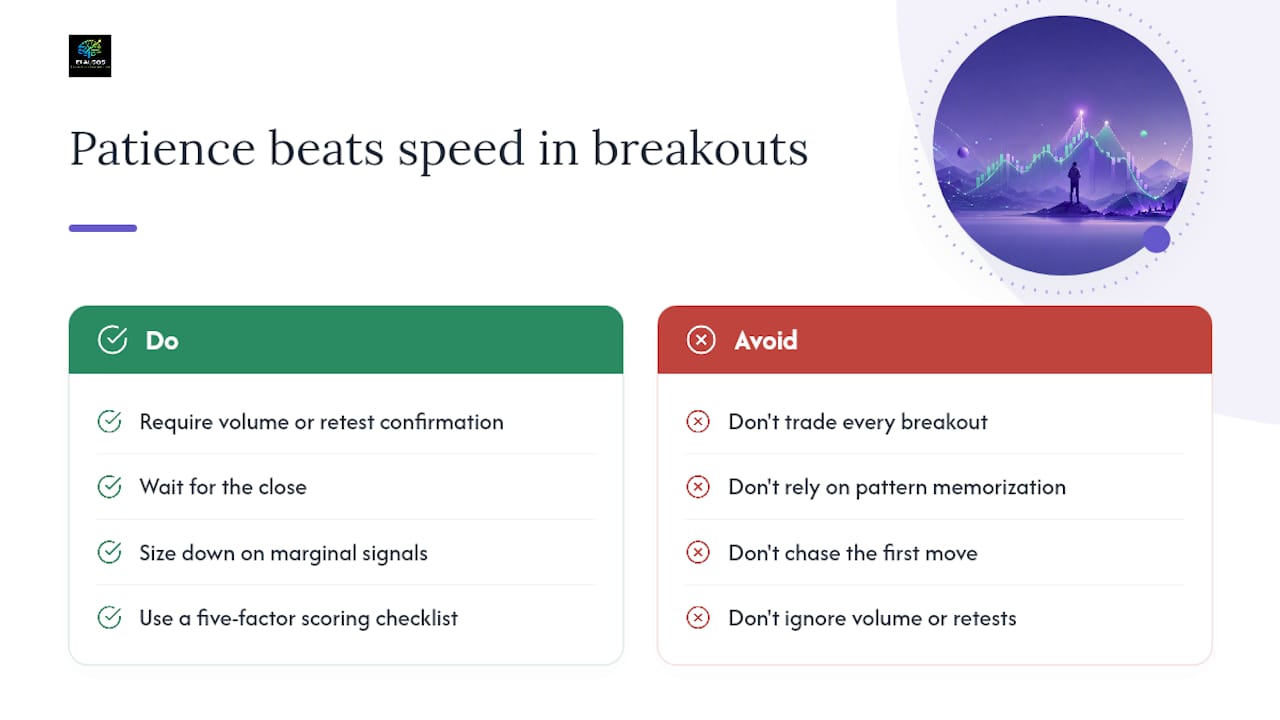
Most breakout content treats confirmation as optional, a nice-to-have for cautious traders. The data says otherwise. On intraday charts, the majority of breakouts fail, which means trading every break without a volume or retest filter is closer to gambling than strategy.
The overrated idea is pattern memorization. Knowing what a pin bar or fakey looks like is table stakes. What separates traders who profit from false breakouts from those who keep getting stopped out is discipline around waiting for the close and sizing down when the score is marginal. Conventional breakout guides sell speed. Real edge here comes from patience, specifically the willingness to skip the first move and take the retest instead.
If you take one thing from this, prioritize the scoring habit over any single pattern. A five-factor checklist run consistently across a hundred trades will teach you more about your own edge than any single "perfect" chart example ever will.
This article is general information, not a substitute for advice from a qualified financial advisor. Consult a qualified financial professional about your own circumstances before acting on anything here.
Sources
- False Breakouts: Why They Happen and How to Trade Them | For Traders
- Failed Structure: When Breakouts Fail and Become the Best Entry (2026) | United Daytraders
- How to Trade Breakouts Without Getting Faked Out (2026)
- Priceaction
Match your source to your instrument. Futures and forex behave differently around round-number levels than individual equities, so check whether a given write-up's examples reflect your market before applying its rules directly.