
Effective options trade analysis means combining a volatility-aware structure, a probability-driven strike selection, and a predefined exit plan before you place a single order. Every analysis must answer six questions: What is the price outlook? What does IV rank say about buying versus selling volatility? Which expiry captures the event or trade horizon? What are the Greek exposures at entry? Is the market liquid enough to enter and exit cleanly? And where exactly do you get out, win or lose?
Here is the core checklist every trade must pass before execution:
- Price outlook: Directional bias, support/resistance levels, and trend confirmation from at least one technical indicator.
- Volatility read: Current IV, IV Rank (IVR), IV Percentile, and skew direction. High IVR favors selling premium; low IVR favors buying it.
- Expiry mapping: The expiry must capture the catalyst or trade horizon. Earnings plays use the nearest weekly that includes the event date.
- Greek exposures: Know your delta (directional exposure), theta (daily decay), vega (volatility sensitivity), and gamma (rate of delta change) at entry.
- Liquidity check: Bid/ask spread under $0.10 for liquid names, open interest above 500 contracts at your strike, and tight markets at the mid-price.
- P&L payoff review: Confirm max profit, max loss, and break-even prices on a payoff diagram before entry.
Pro Tip: Run the expected-move sanity check: if the ATM straddle price implies an 8% expected move (e.g., $3.85 on a $48.77 stock, as in the Novo Nordisk case), and your break-even on a credit spread is inside that range, you have a better chance for profit. Only enter when the break-even sits inside the expected move.
Table of Contents
- What tools and visualizations does every options trader need?
- How do technical indicators help you plan option trades?
- How do IV rank, skew, and regime shifts shape your trade?
- How do you build and optimize a trade from scratch?
- What are the rules for sizing, exits, and execution?
- How does a real earnings trade work from start to finish?
- How does Decision Intelligence augment your options analysis?
- How do you quantify probability of profit and simulate outcomes?
- Key Takeaways
- Why process beats prediction in options trading
- Eialgos brings Decision Intelligence to your pre-trade workflow
- Further reading and authoritative sources
What tools and visualizations does every options trader need?
The right toolkit answers specific questions at each stage of analysis. No single chart does everything. The table below maps each tool to the question it answers and when to reach for it.
| Tool / Visual | Primary Question Answered | When to Use It |
|---|---|---|
| Option chain grid | What are current bid/ask, IV, delta, and open interest at each strike? | Before every trade, to select strikes and check liquidity |
| Payoff diagram | What is max profit, max loss, and break-even at expiry? | During trade construction to confirm risk/reward shape |
| IV surface (3D) | How does implied vol vary across strikes and expiries? | When comparing relative value across the term structure |
| Skew plot | Are puts or calls priced richer? Is the market pricing tail risk? | When choosing between credit spreads and directional debit trades |
| Greeks heatmap | How do delta, gamma, theta, and vega change as price and time move? | For multi-leg positions and portfolio-level risk review |
| Expected-move calculator | What price range does the market imply for a given expiry? | Before earnings or events to size strikes and wings |
| Volume/OI overlay | Where is real activity concentrated? Are there support/resistance shelves? | When selecting strikes and checking for liquidity clusters |
A few practical notes on data quality. Live option chains from your broker feed are acceptable for most retail decisions, but mid-price fills are rarely guaranteed on wide markets. For IV and open interest, use option-level data rather than underlying-level aggregates. Delayed chains (15–20 minutes) are fine for research but not for execution. If you are running backtests or scanning for IV rank across a watchlist, a dedicated data provider with tick-level option history gives you cleaner signals than broker-supplied end-of-day snapshots.
How do technical indicators help you plan option trades?
Technical indicators do not tell you which option to buy. They tell you what the underlying is doing so you can match the right structure and expiry to that behavior. Fidelity's technical analysis guide for options makes this explicit: define your outlook on price, volatility, and time before you execute, and predefine both entry and exit based on that outlook.
The table below maps common indicator signals to trade intent and suggested structures.
| Indicator Signal | Trade Intent | Suggested Structure | Why |
|---|---|---|---|
| Price above rising 50-day MA, RSI 50 | Bullish trend continuation | Long call or bull call spread | Captures directional move with defined risk; longer expiry (45–60 DTE) gives trend time to develop |
| Price below falling 50-day MA, RSI 35–50 | Bearish trend continuation | Long put or bear put spread | Mirrors bullish logic on the downside |
| RSI overbought near resistance | Mean-reversion short bias | Bear call spread or short call vertical | Defined-risk way to sell into exhaustion |
| Bollinger Band squeeze (low bandwidth) | Volatility expansion expected | Long straddle or strangle | Profits from a move in either direction after compression |
| Price oscillating inside Bollinger Bands | Range-bound, mean-reversion | Iron condor or iron butterfly | Collects premium while price stays in range |
| RSI divergence at support | Reversal long bias | Bull put spread or risk reversal | Defined-risk bullish entry at a technical inflection |
Trend-following setups favor longer expiries, typically 45–60 days to expiration (DTE), because the trade needs time for the directional thesis to play out. Mean-reversion structures work better with 21–35 DTE, where theta decay accelerates and the range assumption is more defensible.
Pro Tip: Match your MA length and RSI window to your target DTE. A 20-day RSI paired with a 7-DTE weekly creates a signal mismatch: the indicator is measuring a cycle longer than the trade's life. Use a 9-day RSI for weeklies and a 14-day RSI for monthly expiries.
How do IV rank, skew, and regime shifts shape your trade?
Implied volatility (IV) is the market's forward-looking estimate of how much the underlying will move. IV Rank (IVR) compares current IV to its 52-week range: an IVR of 80 means IV is near the top of its annual range, which favors selling premium. IV Percentile measures how many days in the past year IV was below its current level, giving a distribution-based view rather than a min/max comparison. Skew describes how IV varies across strikes: elevated put skew means the market is paying up for downside protection, which tells you the crowd is more worried about a drop than a rally.
Calculating the expected move from a straddle
Add the ATM call price and the ATM put price for the expiry that captures your event. That sum is the market's expected move to expiration. For example, if a stock trades at $48.77 and the nearest weekly ATM straddle is priced at $3.85, the implied expected move is approximately 8% of the stock price. Use that number to set your short strikes outside the expected range on a condor, or to confirm that a debit spread's break-even sits inside the implied move.
When to sell volatility versus buy it
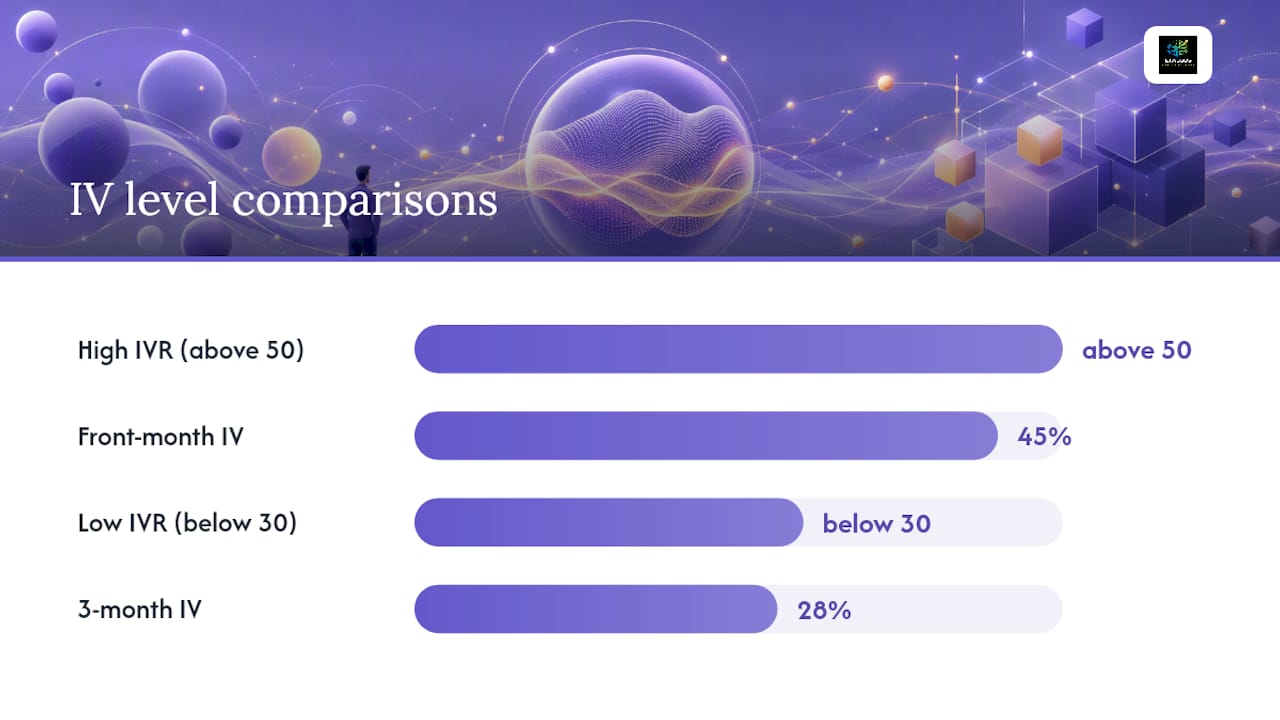
- High IVR (above 50): IV is elevated relative to its history. Selling premium via credit spreads, iron condors, or short strangles captures the vol risk premium. Backtesting on S&P 500 options confirms that short option strategies can outperform when implied volatility systematically overestimates subsequently realized volatility.
- Low IVR (below 30): IV is cheap. Buying debit spreads, long calls, or long puts costs less and gives you better leverage on a directional move.
- Regime shifts: Index-level volatility can compress while single-stock dispersion widens. When the VIX is calm but individual names are moving sharply, defined-risk structures are preferable to outright directional trades until correlation normalizes. This pattern favors iron condors and defined-risk spreads over naked short straddles.
IV crush: Into earnings and major events, near-dated IV typically spikes and then collapses the moment the event resolves. A long straddle bought the day before earnings can lose value even when the stock moves, because the vol premium evaporates faster than the directional gain accrues. Selling the expected move with a defined-risk credit structure captures that collapse.
Pro Tip: Check the multi-tenor term structure before committing. If front-month IV is 45% but 3-month IV is 28%, the term structure is in steep backwardation. That is a signal the market is pricing a near-term event, not sustained elevated vol. Selling front-month premium in that environment carries more risk than the IVR alone suggests.
How do you build and optimize a trade from scratch?
Start with your market view, then let the structure follow from it. The decision matrix below maps view to candidate structure and the primary reason to choose it.
| Market View | Candidate Structure | Net Position | Why Choose It |
|---|---|---|---|
| Moderately bullish | Bull put spread (credit) | Credit received | Profits if stock stays above short put; defined risk |
| Moderately bearish | Bear call spread (credit) | Credit received | Profits if stock stays below short call; defined risk |
| Neutral, high IV | Short iron condor | Credit received | Profits in a range; IV crush accelerates gains |
| Neutral, very high IV | Short iron butterfly | Higher credit | Tighter range, higher premium, more gamma risk |
| Strongly directional, low IV | Long call or long put | Debit paid | Unlimited upside (call) or large downside (put); cheap vol |
| Volatility expansion expected | Long strangle | Debit paid | Profits from a large move in either direction |
Worked numeric examples
Bull put spread: Stock at $100. Sell the $95 put for $2.00, buy the $90 put for $0.80. Net credit = $1.20. Max profit = $1.20 per share ($120 per contract). Max loss = $5.00 spread width minus $1.20 credit = $3.80 ($380 per contract). Break-even = $95 minus $1.20 = $93.80.
Short iron condor: Stock at $100. Sell the $105 call for $1.50, buy the $110 call for $0.60. Sell the $95 put for $1.50, buy the $90 put for $0.60. Total credit = $1.80. Max profit = $1.80 ($180 per contract). Max loss = $5.00 minus $1.80 = $3.20 ($320 per contract). Upper break-even = $105 plus $1.80 = $106.80. Lower break-even = $95 minus $1.80 = $93.20.
Bear call spread: Stock at $100. Sell the $105 call for $1.50, buy the $110 call for $0.60. Net credit = $0.90. Max profit = $0.90 ($90 per contract). Max loss = $5.00 minus $0.90 = $4.10 ($410 per contract). Break-even = $105 plus $0.90 = $105.90.
Liquidity checklist before you enter
- Bid/ask spread: under $0.10 on liquid names; under $0.20 on mid-cap names. Wider than that and slippage eats your edge.
- Open interest: at least 500 contracts at each strike you plan to trade.
- Volume: confirm same-day volume at your strike, not just total chain volume.
- Total cost vs. commissions: on a $0.90 credit spread, a $1.50 round-trip commission per contract represents a meaningful drag. Use a retail desktop platform with per-contract pricing, or a broker API for higher frequency.
What are the rules for sizing, exits, and execution?
Position sizing with a numeric example
Set a maximum risk per trade as a percentage of your account. A common rule is 2% of total capital per position. On a $50,000 account, that is $1,000 maximum risk per trade. If your iron condor has a max loss of $320 per contract, you can trade up to three contracts ($960 total risk, inside the $1,000 limit). Never size to the margin requirement alone. Defined-risk structures require buying power equal to the max loss, not the full notional. Naked short options require substantially more margin and expose you to theoretically unlimited loss on the call side. For U.S. traders, understanding the pattern day trader rule and margin requirements at your broker is a prerequisite before trading undefined-risk structures.
Execution checklist
Use limit orders at the mid-price for multi-leg spreads. If you do not get a fill within two minutes, move the limit one cent toward the market. Avoid market orders on spreads: the bid/ask on a two-leg structure can be $0.30 wide, and a market order guarantees the worst fill. For iron condors and butterflies, enter as a single spread order rather than legging in separately. Legging creates execution risk: the first leg fills and the underlying moves before the second fills, changing your net credit.
Watch for early assignment on short American-style options. Short calls on dividend-paying stocks are at risk of early assignment the day before the ex-dividend date, because the call holder may exercise to capture the dividend. If your short call is deep in the money and the dividend is material, close or roll the position before the ex-date.
| Adjustment Trigger | Action |
|---|---|
| Delta exceeds ±0.30 on a short condor | Roll the tested side out in time or up/down in strike |
| Position at 50% of max loss | Close the trade; do not wait for max loss |
| 21 DTE on a 45-DTE trade | Evaluate closing or rolling; theta decay accelerates but gamma risk rises |
| Short call goes ITM before ex-dividend | Close or roll up before ex-date to avoid assignment |
Pro Tip: Write your adjustment ladder before you enter the trade, not after it starts moving against you. Define three triggers: (1) delta threshold that prompts a roll, (2) max loss percentage that forces a close, and (3) DTE cutoff where you exit regardless of P&L. Decisions made under pressure are rarely better than decisions made in advance.
How does a real earnings trade work from start to finish?
Walk through a hypothetical earnings trade on a stock trading at $100 with an earnings announcement in three days.
Step 1: Calculate the expected move
The nearest weekly expiry that captures the earnings date shows an ATM call at $3.20 and an ATM put at $2.80. Expected move = $3.20 + $2.80 = $6.00, or 6% of the $100 stock price. The market is pricing a $94–$106 range for the expiry. Per the straddle-based expected-move method, this sum is the practical yardstick for strike placement.
Step 2: Compare three candidate structures
| Structure | Net Credit/Debit | Max Profit | Max Loss | Break-Even(s) |
|---|---|---|---|---|
| Bull put spread ($95/$90) | $1.20 credit | $120/contract | $380/contract | $92.80 |
| Short iron condor ($105/$110 call, $95/$90 put) | $1.80 credit | $180/contract | $320/contract | $108.20 / $91.80 |
| Bear call spread ($105/$110) | $0.90 credit | $100/contract | $410/contract | $107.00 |
The short iron condor places both short strikes just outside the $6.00 expected move. The break-evens at $108.20 and $91.80 give a small buffer beyond the implied range.
Step 4: P&L scenarios at expiry
| Stock Price at Expiry | Bull Put Spread P&L | Iron Condor P&L | Bear Call Spread P&L |
|---|---|---|---|
| — | +$120 (max profit) | -$320 (max loss) | -$410 (max loss) |
| $108 | +$120 | +$20 | -$100 |
| $100 | +$120 | +$220 (max profit) | +$100 |
| $93 | -$80 | +$20 | +$100 |
| — | -$380 (max loss) | -$320 (max loss) | +$100 |
The iron condor wins in the base case (stock stays near $100) but loses on a large move in either direction. The bull put spread wins on any outcome above $92.80. The bear call spread profits only if the stock stays below $107.00.
How does Decision Intelligence augment your options analysis?
Technical analysis and volatility metrics tell you what the market is doing. Decision Intelligence tells you how well you are thinking about it. Eialgos's platform scores each trade setup on a six-factor analytical engine that evaluates the psychological and behavioral quality of the decision, not just the market data behind it.
Where DI fits in the pre-trade workflow
The workflow runs in this sequence: Chart and IV analysis → Decision Intelligence score → Decision matrix (pass/fail checklist) → Trade execution → Monitoring and adjustment. The DI score sits between your technical and volatility read and the final go/no-go decision. It does not replace the checklist; it scores the quality of the thinking behind it.
One important clarification: Eialgos does not generate trade signals or tell you what to buy. It scores and explains the quality of your decision process. The trade is always yours. That distinction matters because it builds the kind of repeatable discipline that no signal service can give you. Explore the Eialgos decision guide to see how the six-factor scoring maps to a real pre-trade workflow.
How do you quantify probability of profit and simulate outcomes?
Quick probability calculations
Delta as probability proxy: An option's delta approximates the market's probability that the option expires in the money. A short put with a delta of 0.20 has roughly a 20% chance of expiring ITM, meaning an 80% probability of expiring worthless. This is a fast, practical estimate, not a precise statistical claim, but it is directionally reliable for strike selection.
Break-even probability: For a credit spread with a break-even at $93.80 on a $100 stock, calculate the percentage move required: ($100 minus $93.80) / $100 = 6.2%. Compare that to the expected move derived from the straddle. If the expected move is 6%, the break-even is right at the edge of the implied range, which means the probability of profit is close to 50%. Move the short strike further out to improve the probability.
Expected value: Multiply the probability of max profit by max profit, then subtract the probability of max loss times max loss. On the bull put spread above: (0.80 × $120) minus (0.20 × $380) = $96 minus $76 = $20 expected value per contract. Positive expected value does not guarantee profit on any single trade, but it is the right metric to evaluate a strategy over many repetitions.
Simulation methods
A simple Monte Carlo simulation for options P&L runs as follows:
- Set the underlying's daily return distribution (use historical realized vol or the ATM IV as the annualized input).
- Generate at least 100,000 price paths to expiry, each using a random daily return drawn from the distribution.
- For each path, calculate the option payoff at expiry.
- Average the payoffs to get the simulated expected value; sort the distribution to read off the 5th and 95th percentile outcomes.
Monte Carlo requires at least 100,000 paths for stable trade-level decisions; fewer paths produce noisy results that can mislead position sizing. A binomial tree is faster for American-style options and handles early-exercise correctly, which Black-Scholes cannot. For strategies with significant skew sensitivity, a stochastic-vol model such as Heston better captures the vol surface than Black-Scholes. Choosing the right pricing model matters: if a stochastic-vol model prices OTM puts materially higher than Black-Scholes, that gap signals vol-of-vol or jump risk priced by the market, and it is worth taking seriously rather than dismissing as a model artifact.
| Model | Best For | Limitation |
|---|---|---|
| Black-Scholes | Fast European-style pricing, theoretical value baseline | Cannot handle early exercise; misses skew |
| Binomial tree | American-style options, dividend-adjusted pricing | Slower; requires careful step calibration |
| Heston (stochastic vol) | Skew-sensitive strategies, vol surface fitting | More complex to implement; requires calibration |
| Monte Carlo | Multi-leg P&L simulation, path-dependent payoffs | Computationally intensive; needs ≥100,000 paths |
Pro Tip: Use simulation output to size positions via expected value, not just max loss. If the simulated 5th-percentile outcome on a three-contract iron condor is a $840 loss and your account risk limit is $1,000, you have a tail-risk buffer. If the 5th-percentile loss exceeds your limit, reduce to two contracts before entry.
Key Takeaways
Effective options trade analysis combines a volatility-aware structure, a probability-driven strike selection, and a predefined exit plan, applied consistently through a repeatable pre-trade workflow.
| Point | Details |
|---|---|
| Read the expected move first | Sum the ATM call and put prices for the event expiry; that total sets your strike placement and break-even targets. |
| Match structure to IV environment | High IVR favors credit structures (condors, spreads); low IVR favors debit structures (long calls, long puts). |
| Define exits before entry | Set a profit target, a max-loss stop, and a DTE exit trigger in writing before placing the first leg. |
| Size to max loss, not margin | Calculate contract count so total max loss stays within 2% of account capital, regardless of margin requirements. |
| Score decisions with Eialgos | Eialgos's six-factor Decision Intelligence engine flags behavioral errors and scores setup quality before you commit capital. |
Why process beats prediction in options trading
Most traders spend the majority of their preparation time trying to forecast where the stock will go. That is understandable, but it is also the wrong priority. The expected move calculation makes this concrete: the market has already priced a probability distribution into the option chain. Your job is not to out-forecast the market; it is to find structures where the priced move is rich relative to what the underlying actually does, and to execute those structures with enough discipline to let the edge compound over time.
Behavioral consistency is harder to build than technical skill. A trader who understands iron condors but abandons the exit plan when a position moves against them will underperform a trader with a simpler strategy and a rigid process. The pre-trade checklist, the adjustment ladder, and the process-oriented trading framework are not bureaucratic overhead. They are the mechanism by which good decisions become repeatable.
The most overlooked element in options analysis is the post-trade review. Comparing your pre-trade score to the realized outcome, over dozens of trades, reveals which biases cost you the most. That feedback loop, built into a trading journal, is where real improvement happens. Not in finding a better indicator, but in understanding why you deviated from the plan when you did.
Eialgos brings Decision Intelligence to your pre-trade workflow
Every element of the workflow described here, from the IV check to the exit ladder, requires a clear head and a consistent process. Eialgos gives self-directed options traders a structured way to score that process before capital is at risk.
The platform's six-factor analytical engine evaluates the behavioral and psychological quality of each trade setup, not just the market data. LIANA, the AI assistant, surfaces personalized feedback on your decision patterns over time, so you can see exactly where your process breaks down and why. Live trade management tools keep your exit plan visible while a position is open, reducing the chance of an emotional override when the market moves.

Where most tools give you more data, Eialgos gives you a score on how well you are using the data you already have. That is a different kind of edge: one that compounds with every trade you review, not just the ones that go right. Start with the free plan and run your next options setup through the six-factor engine before you place the order. Visit Eialgos to see the subscription tiers and get started.
Further reading and authoritative sources
These sources back the specific sections of this guide and are worth reading in full.
-
Technical Analysis for Options Trading (Fidelity): — Covers how moving averages, RSI, and Bollinger Bands translate into options entry and exit decisions, and the principle of predefining outlook before execution. Backs the technical indicators section and the pre-trade checklist.
-
Selling the Expected Move: A Novo Nordisk Earnings Case Study (Saxo): — Demonstrates the ATM straddle method for deriving the expected move, IV crush behavior around earnings, and the logic for selling defined-risk credit structures into events. Primary source for the case study and volatility sections.
-
Analysis of Option Trading Strategies Based on the Relation of Implied and Realized S&P 500 Volatilities (ResearchGate): — Academic backtesting evidence that short option strategies can outperform when implied vol systematically exceeds realized vol. Backs the simulation and strategy-construction sections.
-
Model Selection: Which Pricing Model? (Options Analysis Suite): — Practical guidance on choosing between Black-Scholes, binomial, Heston, and Monte Carlo for different option types and strategies, including the recommendation to treat model disagreement as a signal. Backs the probability and simulation section.
-
Iran Stands Down, Tech Splits: Options Brief (Saxo): — Illustrates regime-shift dynamics where index volatility compresses while single-stock dispersion widens, supporting the guidance to prefer defined-risk structures when correlation is low. Backs the volatility regime and trade-construction sections.