
Start with the Google Sheets trading journal template — it's free, cloud-synced, and ready the moment you duplicate it. Day traders get instant cross-device access with no software install. Swing traders benefit from the built-in equity curve and per-setup expectancy rows. Options traders should grab the Notion version, which handles multi-leg entries and embedded chart screenshots cleanly.
Three reasons this pick works immediately:
- Fields that matter: Date, symbol, setup name, setup grade, direction, entry/stop/target, position size in R, execution quality, emotional state, R-multiple result, and a brief post-trade note — all pre-built.
- Zero friction: Duplicate the sheet in one click, set your account currency and timezone, and log your first trade in under two minutes.
- Immediate diagnostic value: R-multiple normalization and setup grading let you spot which setups are profitable and which are behavioral traps within your first 20 trades.
Eialgos complements any of these formats by scoring the decision quality behind each trade — not the outcome — using a six-factor behavioral engine.
Key Takeaways
A minimal, consistently maintained trading journal template with R-multiple tracking and a weekly post-mortem produces more usable insight than any complex system used sporadically.
| Point | Details |
|---|---|
| Pick your format first | Google Sheets for cloud access, Excel for offline control, Notion for narrative and screenshots. |
| Log 12 core fields only | Setup name, grade, R-multiple, emotional state, and execution quality are the fields that drive improvement. |
| Run three review cadences | Daily (5–10 min), weekly post-mortem (20–30 min), and monthly expectancy review (45–60 min). |
| Adapt fields by market | Add IV rank for options, tick value for futures, pip sizing for forex — keep core fields identical. |
| Add Eialgos for decision scoring | When volume and pattern complexity exceed what manual review can handle, Eialgos's behavioral engine fills the gap. |
Table of Contents
- Which trading journal template should you download right now?
- What does a good trading journal template actually include?
- How to use your template: a daily, weekly, and monthly review routine
- Excel vs Google Sheets vs Notion vs automated journals
- How to adjust your template by market: stocks, options, forex, futures
- What your starter template contains and how to set it up in minutes
- How Eialgos complements your trading journal
- Why starting simple beats waiting for the perfect tool
- Eialgos scores your decisions, not just your trades
- Sources
Which trading journal template should you download right now?
Free spreadsheet templates in Excel and Google Sheets give you the core trade logging structure and simple performance metrics you can use immediately. Here are the top picks:
- Google Sheets template (best for active traders, cross-device): Free, shareable, and auto-saves. A community-tested version is available directly on Reddit's r/Daytrading. Start logging in under five minutes.
- Microsoft Excel template (best for formula-heavy users and offline work): Full control over custom formulas, pivot tables, and conditional formatting. No internet required. Download from TradingSim or build from the field list in Section 3.
- Notion trading journal template (best for narrative entries and screenshots): Pre-built properties for per-trade fields, embedded chart images, and linked databases for your playbook. Ideal for swing traders who write detailed post-trade notes.
- Automated import tools (best for high-volume traders who want broker CSV imports and analytics dashboards): These platforms pull trades directly from your broker and calculate metrics automatically. Expect a monthly cost. Worth it once you're logging 20+ trades per week and need pattern detection at scale.
What does a good trading journal template actually include?
Raw P&L tells you what happened. Contextual fields tell you why. Capturing setup grade, execution quality, and emotional state is what turns a trade log into a diagnostic tool.
Per-trade fields (the non-negotiables)
- Date and time of entry
- Symbol or instrument
- Setup name (from your playbook)
- Setup grade (A/B/C — your pre-trade confidence rating)
- Direction (long/short)
- Entry price, stop-loss level, and target price
- Position size expressed in R (risk units)
- Execution quality (did you follow your rules exactly?)
- Emotional state at entry (one word: calm, anxious, FOMO, bored)
- R-multiple result (actual outcome divided by initial risk)
- Post-trade note (one to two sentences maximum)
- Screenshot or chart link
R-multiple normalization and a fixed emotional-state scale are the two fields most traders skip but most need for analysis. Dollar P&L varies with position size; R-multiple does not. That consistency is what makes patterns visible across weeks and months.
Dashboard metrics your template should calculate
| Metric | Why it matters |
|---|---|
| Win rate | Baseline frequency, but meaningless without average R |
| Average R winner / loser | Reveals your actual edge per setup |
| Expectancy (avg R per trade) | Single best measure of system quality |
| Profit factor | Gross wins divided by gross losses |
| Running equity curve | Visualizes drawdown periods and consistency |
| Per-setup expectancy table | Shows which setups to trade more and which to cut |
How to use your template: a daily, weekly, and monthly review routine
The journal's value comes from the review cadence, not from having more fields. Three cadences keep the loop tight.
- Daily (5–10 minutes, end of session): Log every trade immediately while the context is fresh. Record setup name, grade, emotional state, and R-multiple. Attach a screenshot. Write one sentence on execution quality. Do not write lessons here — that belongs in the weekly post-mortem.
- Weekly (20–30 minutes, weekend): Group trades by setup name. Calculate win rate and average R per setup. Ask: which setups are performing, which are underperforming, and did emotional state correlate with execution errors? This is where per-trade lessons belong — not in the individual trade row.
- Monthly/quarterly (45–60 minutes): Review expectancy trends, equity curve shape, and whether any structural changes (new market regime, new setup) are needed. Update your playbook.
Pro Tip: Set a recurring calendar block for your weekly post-mortem — Sunday at the same time every week. Traders who schedule it complete it. Those who leave it open skip it.
Keeping entries short is a discipline, not a shortcut. Pre-trade rationale in two sentences, emotional state in one word, R-multiple as a number. Brevity keeps completion rates high and makes pattern detection faster.
Excel vs Google Sheets vs Notion vs automated journals
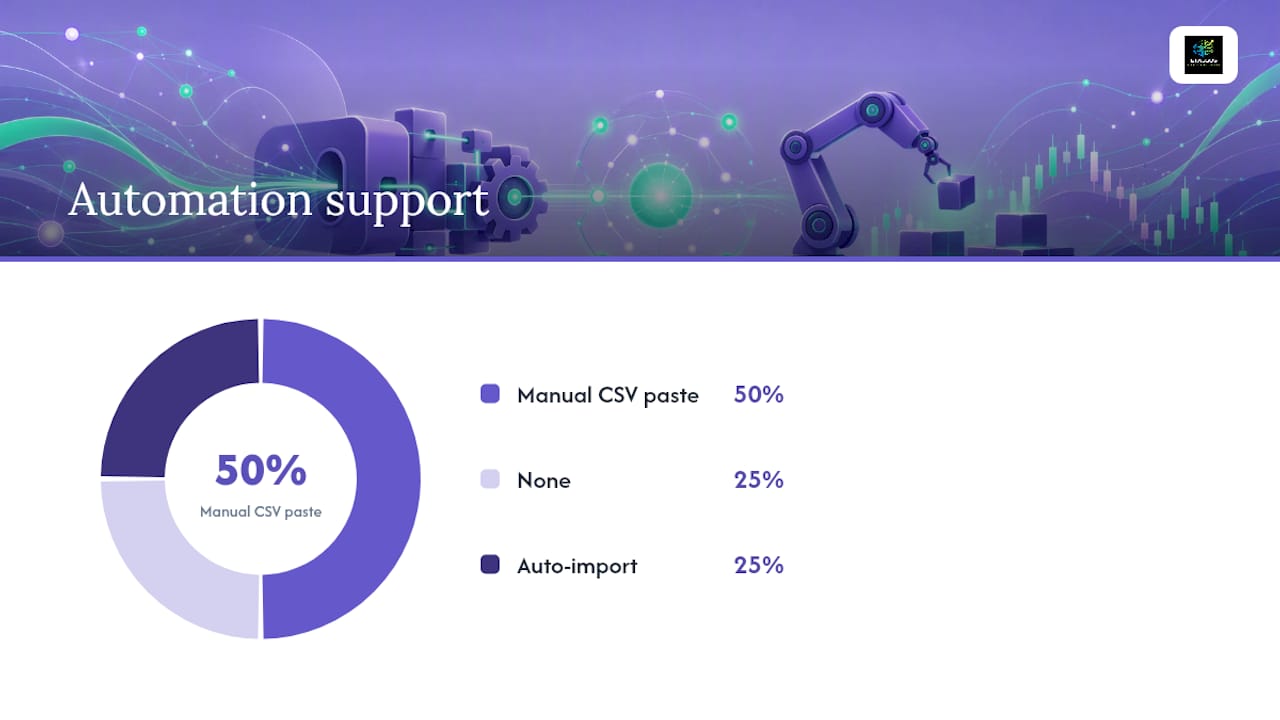
Spreadsheets are free and customizable; Notion is strong for narrative and screenshots; dedicated tools offer auto-import and analytics at a cost. Here's how to choose by need:
| Format | Best for | Automation / import | Cost | Customizability | Analytics / dashboard | Scalability |
|---|---|---|---|---|---|---|
| Google Sheets | Cloud access, collaboration, quick start | Manual CSV paste | Free | High | Basic (formulas, charts) | Moderate |
| Microsoft Excel | Offline use, complex formulas, privacy | Manual CSV paste | Free (if owned) | Very high | Intermediate (pivot tables) | Moderate |
| Notion | Narrative entries, screenshots, playbook linking | None | Free / paid tiers | High (flexible DB) | Minimal | Low to moderate |
| Automated tools | High-volume traders, broker import, pattern detection | Auto-import | Paid | Low to moderate | Advanced | High |
Decision rule: if you want sub-one-minute daily logging, choose an automated import tool or a minimal spreadsheet with pre-filled dropdowns. If narrative and chart context matter more than speed, Notion wins. If you want zero cost and full formula control, stay in Excel or Google Sheets. For a deeper look at digital journaling tool trade-offs, the comparison between popular dedicated platforms covers automation and pricing in detail.
How to adjust your template by market: stocks, options, forex, futures
Keep the 12 core fields identical across all markets so R-multiples and setup grades remain comparable. Add only the market-specific fields below.
- Stocks: Add a corporate event flag (earnings, dividend date), lot size, and commission per share. Flag trades taken within three days of earnings as higher-risk entries.
- Options: Add leg structure (single, vertical, iron condor), Greeks snapshot at entry (delta, IV rank), implied volatility percentile, and execution type (market vs. limit). IV rank at entry is the single highest-impact addition for options traders.
- Forex: Add account currency, overnight swap cost, and pip value per lot. Pip sizing varies by pair and lot size — pre-calculate it in a lookup table to avoid manual errors.
- Futures: Add contract month, tick value, and margin requirement at entry. Tick value is non-negotiable for accurate R-multiple calculation in futures.
For U.S. active traders, also check whether your template tracks day-trade counts. The pattern day trader rule requires a minimum account balance for traders who execute four or more day trades in five business days — your log should flag that threshold automatically.
What your starter template contains and how to set it up in minutes
A well-structured starter template has four tabs. Here's what each one does:
| Tab | Contents | Purpose |
|---|---|---|
| Trade Log | One row per trade, all 12 core fields | Primary data entry and raw record |
| Dashboard | Summary metrics, equity curve chart | Performance review at a glance |
| Setups | Playbook list with setup names and rules | Dropdown source for setup name field |
| Screenshots | Folder path or external link column | Chart reference without bloating the file |
Setup takes under five minutes:
- Duplicate the Google Sheets template (File → Make a copy) or open the Excel file.
- Set your account currency in the Dashboard tab's settings row.
- Set your timezone in the Trade Log header (critical for session-time analysis).
- Paste your setup names into the Setups tab to populate the dropdown in the Trade Log.
- Optionally, create a shared Google Drive folder for screenshots and paste the folder URL into the Screenshots tab.
Populated trading journal examples show what useful entries look like versus minimal ones — short exit notes, externally linked screenshots, and consistent field completion across every row.
Pro Tip: Link your TradingView chart screenshots to the Screenshots column using a shared folder URL. This keeps your spreadsheet lightweight while preserving full chart context for post-mortems.
How Eialgos complements your trading journal
A journal records what you did. Eialgos scores why you did it — and whether the decision was sound before the outcome was known.
Eialgos's core capabilities that go beyond any spreadsheet:
- Six-factor decision scoring: Each setup is evaluated on behavioral and psychological dimensions, not just price action.
- Behavioral error detection: The platform flags recurring decision mistakes — overtrading, revenge entries, size violations — across your trade history.
- Live trade management assistance: Real-time guidance during an open trade, not just post-trade analysis.
- LIANA AI assistant: Personalized feedback on your decision patterns, updated as your journal data grows.
The practical integration: use your Google Sheets or Excel log as the source of truth for raw trade data, then run your setups through Eialgos's decision-scoring guide to get behavioral scores alongside your R-multiple results. The two systems answer different questions — the journal asks "what happened," Eialgos asks "was the decision process sound."
Pro Tip: When your spreadsheet holds 60 or more trades and you notice you can't manually spot which behavioral patterns are driving losses, that's the signal to add automated decision scoring. Volume plus pattern complexity is the threshold.

Why starting simple beats waiting for the perfect tool
Most traders over-engineer their first journal. They add 25 fields, build elaborate dashboards, and then stop logging after two weeks because entry takes too long.
Three rules that actually work: log every trade without exception, keep pre-trade rationale to two sentences maximum, and run a weekly post-mortem by setup rather than by individual trade. The minimal 12-field approach keeps completion rates high and produces reliable patterns faster than a complex template that gets abandoned.
The common failure mode is mixing post-mortem lessons into the per-trade entry. It slows logging and creates noise in the data. Keep the trade row clean and short. Put the analysis where it belongs: the weekly review.
Consistency over complexity is the only rule that matters long-term. A simple log maintained every day for three months produces more usable insight than a sophisticated system used sporadically.
Eialgos scores your decisions, not just your trades
Spreadsheets and Notion templates are excellent starting points. But they record outcomes. Eialgos measures the quality of the decision that produced those outcomes — before the market gives its verdict.
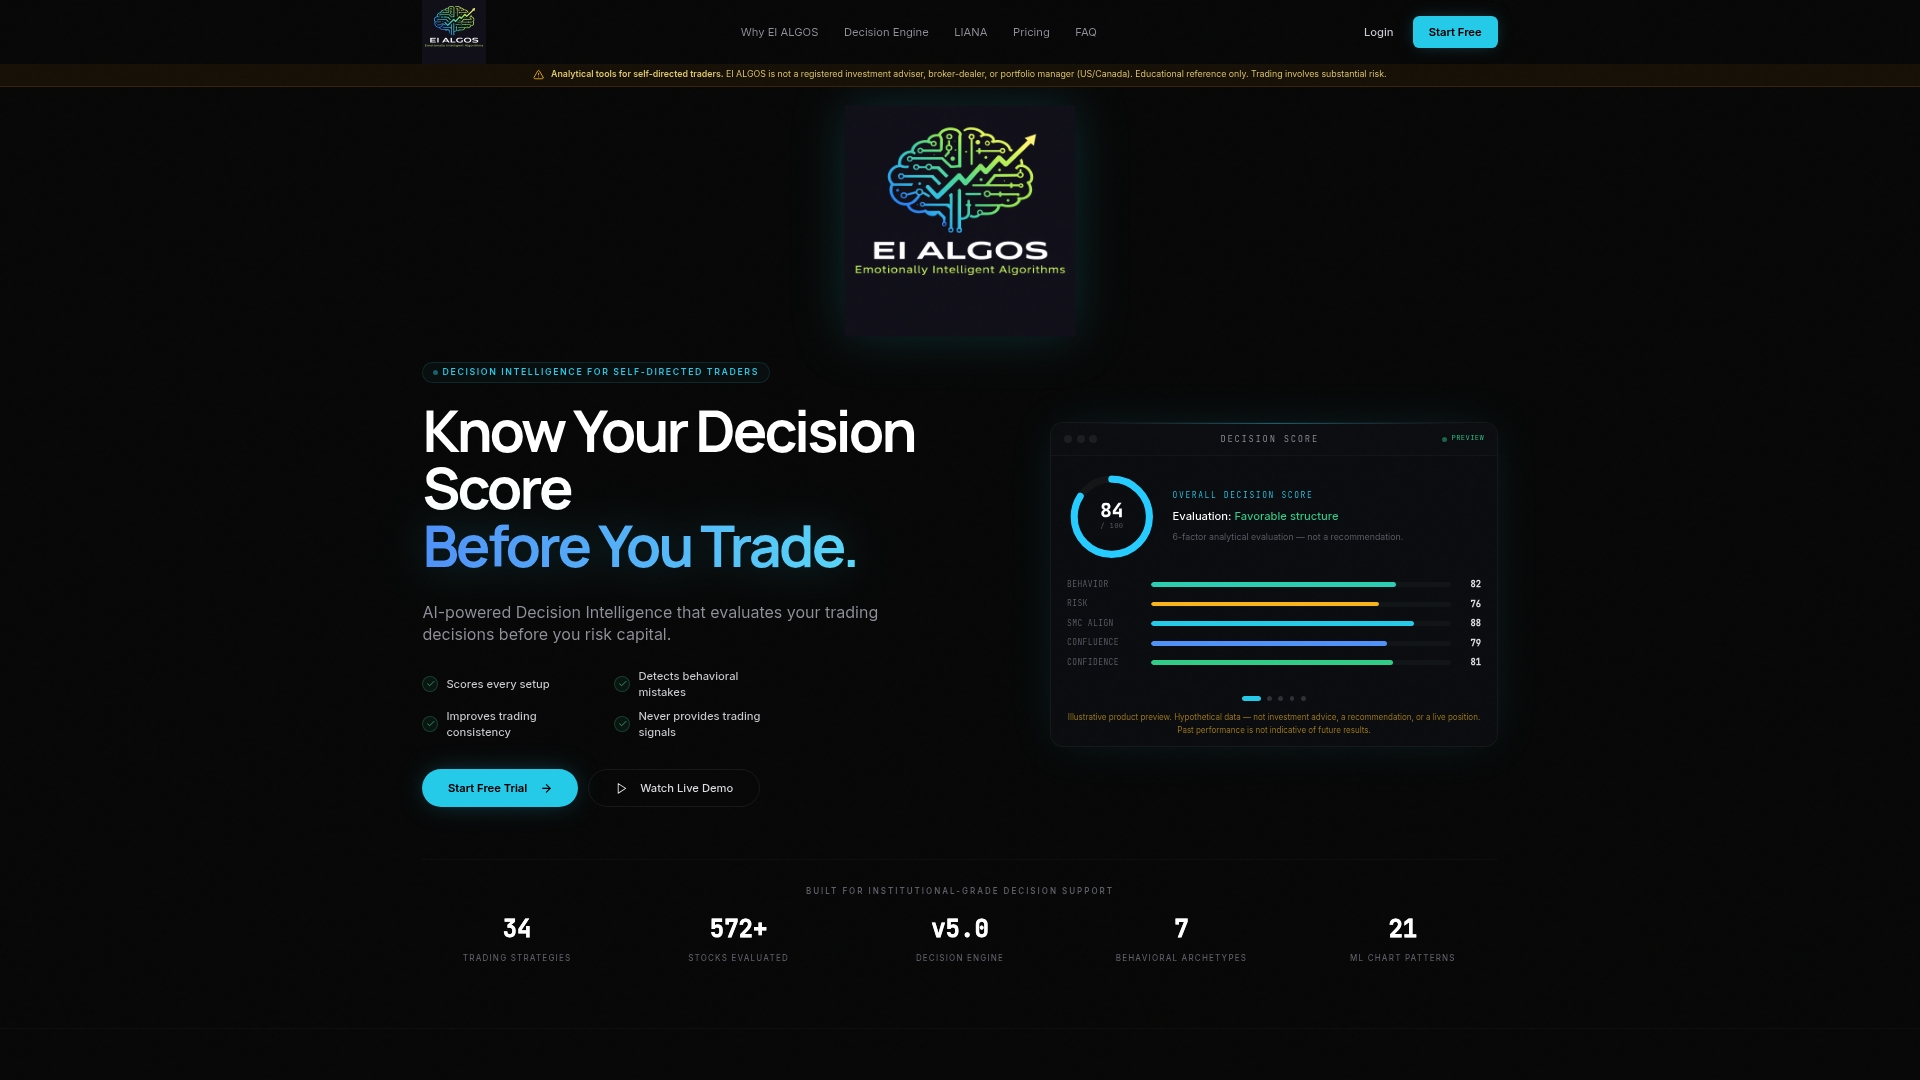
For traders who have a journal but still can't pinpoint why they keep repeating the same mistakes, Eialgos's six-factor behavioral scoring and LIANA assistant provide the layer that spreadsheets can't. No trade signals. No generic recommendations. Just a clear score on whether your decision process was sound, and specific feedback on where it broke down. A free tier is available — start scoring your setups today and see which behavioral patterns are costing you the most.
Sources
- How to Create a Trading Journal That Improves Results 2026
- Trading Journal: The Complete Guide with AI Insights (2026)
- The Trading Journal And Post-Mortem Template We Actually Use — Tradoki blog
- Trading Journal Template: Free Excel, Google Sheets & ...
- How to Build the Best Trading Journal Online (Template)