
Strategy drift is the gradual gap that opens between a trading system's original tested rules and how it actually performs live. The moment you notice that gap, pause further rule edits and run a diagnostic comparison of live versus backtested results before touching anything else. From there, the fix follows a clear path: detect the drift with the right metrics, tighten your controls, and build a repeatable playbook to keep it from coming back.
TL;DR:
- Confirm that you followed your rules and have a large enough sample before calling drift; compare live and backtested results using rolling performance metrics.
- Use regime diagnostics and change point tests because a high average Sharpe ratio can conceal a collapse in one market regime; set review triggers in advance.
- Once drift is confirmed, freeze edits, reduce exposure or switch to paper trading, adjust position size to volatility, and keep single trade risk near 1% to 2%.
- Require walk forward and out of sample validation before full redeployment, then restart at half size for two weeks after any rule change.
- Keep daily alerts for outlier trades, review performance weekly, audit regimes monthly, and log decisions for 30 days to distinguish execution errors from strategy failure.
Table of Contents
- What Strategy Drift Is and the Stages It Follows
- Behavioral and Structural Causes of Drift
- How to Detect and Measure Drift
- Controls and Design Changes to Stop or Reverse Drift
- Decision Intelligence and Behavioral Detection in Practice
- Playbook: Step-by-Step Checklist to Diagnose and Monitor Drift
- Integrating Your Own Behavioral Data Into Strategy Evaluation
- Educational Approaches Beyond the Technical Metrics
- Process Discipline Beats Ad-Hoc Fixes
- How Decision Intelligence Fits Your Drift Playbook
- FAQ
- Sources
What Strategy Drift Is and the Stages It Follows
Strategy drift is not the same as a normal losing streak or a single discretionary mistake. A losing streak sits inside your strategy's expected variance; a discretionary error is a one-off break from your rules. Drift is slower and more structural: your edge erodes even though you believe you are still following the same system, often because small, undocumented changes have accumulated or because the market regime underneath your strategy has shifted.
We find it useful to think of drift in stages, borrowed from how analysts track gradual system failure:
- Incremental change: small parameter tweaks or rule exceptions creep in, each one individually defensible.
- Slow erosion: performance metrics soften quietly, often masked by a few good trades.
- Flux: results become inconsistent and hard to attribute to any single cause.
- Structural failure: the strategy no longer resembles what was originally tested, and losses accelerate.
Market regime shifts and alpha decay are common underlying drivers. A strategy tuned to a trending, low-volatility market can look broken the moment correlations or volatility structure change, even though no rule was technically violated.
Behavioral and Structural Causes of Drift
Drift rarely has one cause. It typically comes from a mix of behavioral habits, operational slippage, and genuine market change, and separating the three matters because each needs a different fix.
- Overtrading: taking more setups than your plan allows, often driven by the activity fallacy, the belief that more trades mean more control.
- Confirmation bias: favoring information that supports a position you already hold instead of the signal your rules require.
- Boredom and loss aversion: cutting winners early or holding losers too long, a pattern explored in our loss aversion coverage.
- Parameter creep: adjusting stop distances or entry filters without documenting why, until the live system no longer matches the backtest.
- Market-level shifts: changing volatility regimes or breaking correlations that quietly invalidate the assumptions behind your original edge.
A partner resource on behavioral finance biases outlines simple rules investors can use to catch these patterns before they compound.
Pro Tip: Log every rule exception the moment it happens, not at the end of the week, so you can see creep accumulate in real time.
How to Detect and Measure Drift
Before you conclude that drift is real, confirm you actually followed your own rules and that your sample size is large enough to say anything meaningful. Testing too early, on too few trades, is how traders chase noise.
- Check rule adherence first. Rule out discretionary error before blaming the system itself.
- Track rolling metrics. Rolling Sharpe ratio, rolling hit-rate, rolling drawdown, and volatility-adjusted returns reveal whether performance is softening gradually or just noisy.
- Apply regime-aware diagnostics. Minimum Regime Performance (MRP) measures the lowest risk-adjusted return a strategy produced across distinct historical regimes, giving you a lower bound on robustness rather than just an average. A high Sharpe ratio can hide a strategy that collapses in one specific regime.
- Run change-point tests. These flag the point where a performance series statistically shifts, separating a true regime change from ordinary variance.
- Protect backtest hygiene. Use walk-forward testing and Monte Carlo simulation, and watch for look-ahead and survivorship bias, two of the most common ways backtests overstate real performance.
- Set a decision threshold. Decide in advance how many standard deviations of underperformance, or how many consecutive weak regime readings, trigger a formal review.
Robust evaluation that extends the testing horizon and the universe of instruments tends to shrink the apparent edge of complex strategies, which is exactly why regime-aware testing matters more than chasing a higher backtested Sharpe ratio.
Controls and Design Changes to Stop or Reverse Drift
Once diagnostics confirm drift, the response should be mechanical, not emotional. Start with triage, then move to structural fixes that outlast the current episode.
- Freeze edits immediately. No new rule changes until the diagnostic is complete.
- Isolate live from paper. Move the suspect strategy to a paper or reduced-size environment while you investigate.
- Scale size to volatility. Use volatility-adjusted position sizing rather than fixed contract counts, so exposure shrinks automatically when conditions turn hostile.
- Cap leverage and set fixed stops. The 1%-2% risk rule remains a sound baseline for limiting single-trade damage.
- Version your releases. Treat each rule change like a software release: document it, date it, and never deploy without an out-of-sample test first.
- Require walk-forward validation before redeployment. A strategy only returns to full size after it passes a fresh out-of-sample window, not just a strong backtest.
Trade and risk management education consistently stresses that capital allocation and explicit exit rules, set in advance and followed mechanically, do more to prevent overtrading than any single indicator. Our own guidance on trade management strategies covers position-sizing frameworks you can apply directly to this step.
Pro Tip: Re-deploy at half size for the first two weeks after any rule change, even one that passed walk-forward testing cleanly.
Decision Intelligence and Behavioral Detection in Practice
Technical diagnostics catch structural drift, but much of what erodes a strategy starts as a behavioral pattern long before it shows up in a performance chart. Scoring each trade decision, not just each trade outcome, surfaces those patterns earlier.
- Behavioral decision scoring evaluates the setup and the reasoning behind it, not just whether the trade made money, which helps separate a sound process that lost from a broken process that happened to win.
- A six-factor analytical lens applied consistently across trades can surface recurring errors, like repeated overtrading after a loss or entries taken against a documented filter, before they accumulate into full strategy drift.
- A structured 30-day review gives enough trades to see a pattern rather than a coincidence; our 30-day behavioral analysis walks through how to structure that window.
The workflow is simple: run the review window, map each flagged error to a specific rule or habit, and adjust one variable at a time rather than overhauling the system at once. Volatility-regime decision scoring is one example of how regime awareness and behavioral review can work side by side instead of as separate exercises.
Playbook: Step-by-Step Checklist to Diagnose and Monitor Drift
A repeatable sequence beats ad-hoc fixes every time a strategy starts to wobble.
- Freeze all rule changes and pull a comparison window of live versus backtested results.
- Run rolling and regime diagnostics, including MRP and change-point tests, and document every finding.
- Tighten risk controls, scaling position size and confirming stop placement, then re-test the adjusted rules in a walk-forward window.
- Re-deploy only after passing out-of-sample validation, and set explicit monitoring thresholds before going live again.
- Maintain a monitoring cadence: daily automated alerts for outlier trades, a weekly performance review, and a monthly regime audit to catch slower shifts.
Each step produces a dated record, which turns your next drift episode from a guessing game into a quick lookup.
Integrating Your Own Behavioral Data Into Strategy Evaluation
A backtest tells you what the rules should produce. Your trading history tells you what actually happened when you executed them, and the gap between the two is often where drift hides. Feeding your own decision history, not just your P&L, back into strategy evaluation closes that gap.
This means tracking which setups you skipped, which ones you sized up on a hunch, and which rule exceptions you made under stress, then correlating those patterns against the periods where performance diverged from backtest expectations. A strategy that looks statistically sound on paper can still drift in your hands if your execution consistently deviates from the tested version in a specific, repeatable way.
Our trader behavior analysis resources are built around this idea: treating your personal behavioral record as a dataset worth evaluating alongside your trade log, not as background noise to the numbers. Over time, this integration lets you distinguish a strategy problem from an execution problem, which changes the fix entirely. A strategy problem calls for a parameter review; an execution problem calls for tighter discipline controls, often the cheaper and faster correction of the two.

Educational Approaches Beyond the Technical Metrics
Metrics alone will not keep a trader from drifting, because most drift starts as a habit before it becomes a number. Pairing statistical diagnostics with ongoing education about your own decision patterns closes that gap.
Structured trade review, where you walk back through a decision and ask what you actually saw versus what your rules required, builds the kind of pattern recognition that a rolling Sharpe ratio cannot teach on its own. Our guidance on trading discipline and on how to stop overtrading focuses on measurable habits rather than vague willpower, which fits the same diagnostic mindset used for statistical drift detection.
A partner guide on measuring investment outcomes outside the trading world makes a similar point: systematic, dated measurement beats intuition in any asset class, not just equities or futures. Applying that same habit of regular, structured self-assessment to your own trading record is one of the more durable ways to catch drift before it becomes expensive.

Process Discipline Beats Ad-Hoc Fixes
Drift is a system-design problem, not a one-time glitch to patch and forget. Steady monitoring and documented rules do more to protect an edge than any clever indicator.
Favor small, testable changes over sweeping overhauls, and trust a structured review over a gut feeling about what "should" be working. The traders who recover fastest from drift are the ones who already had a repeatable process in place before it started.
— Anantha
How Decision Intelligence Fits Your Drift Playbook
Our platform supports the behavioral side of this playbook. A six-factor scoring system can evaluate the decision behind each setup, an AI assistant can turn that scoring into plain-language feedback on your own patterns, and trade review tools can keep a versioned, dated record of every rule change made.
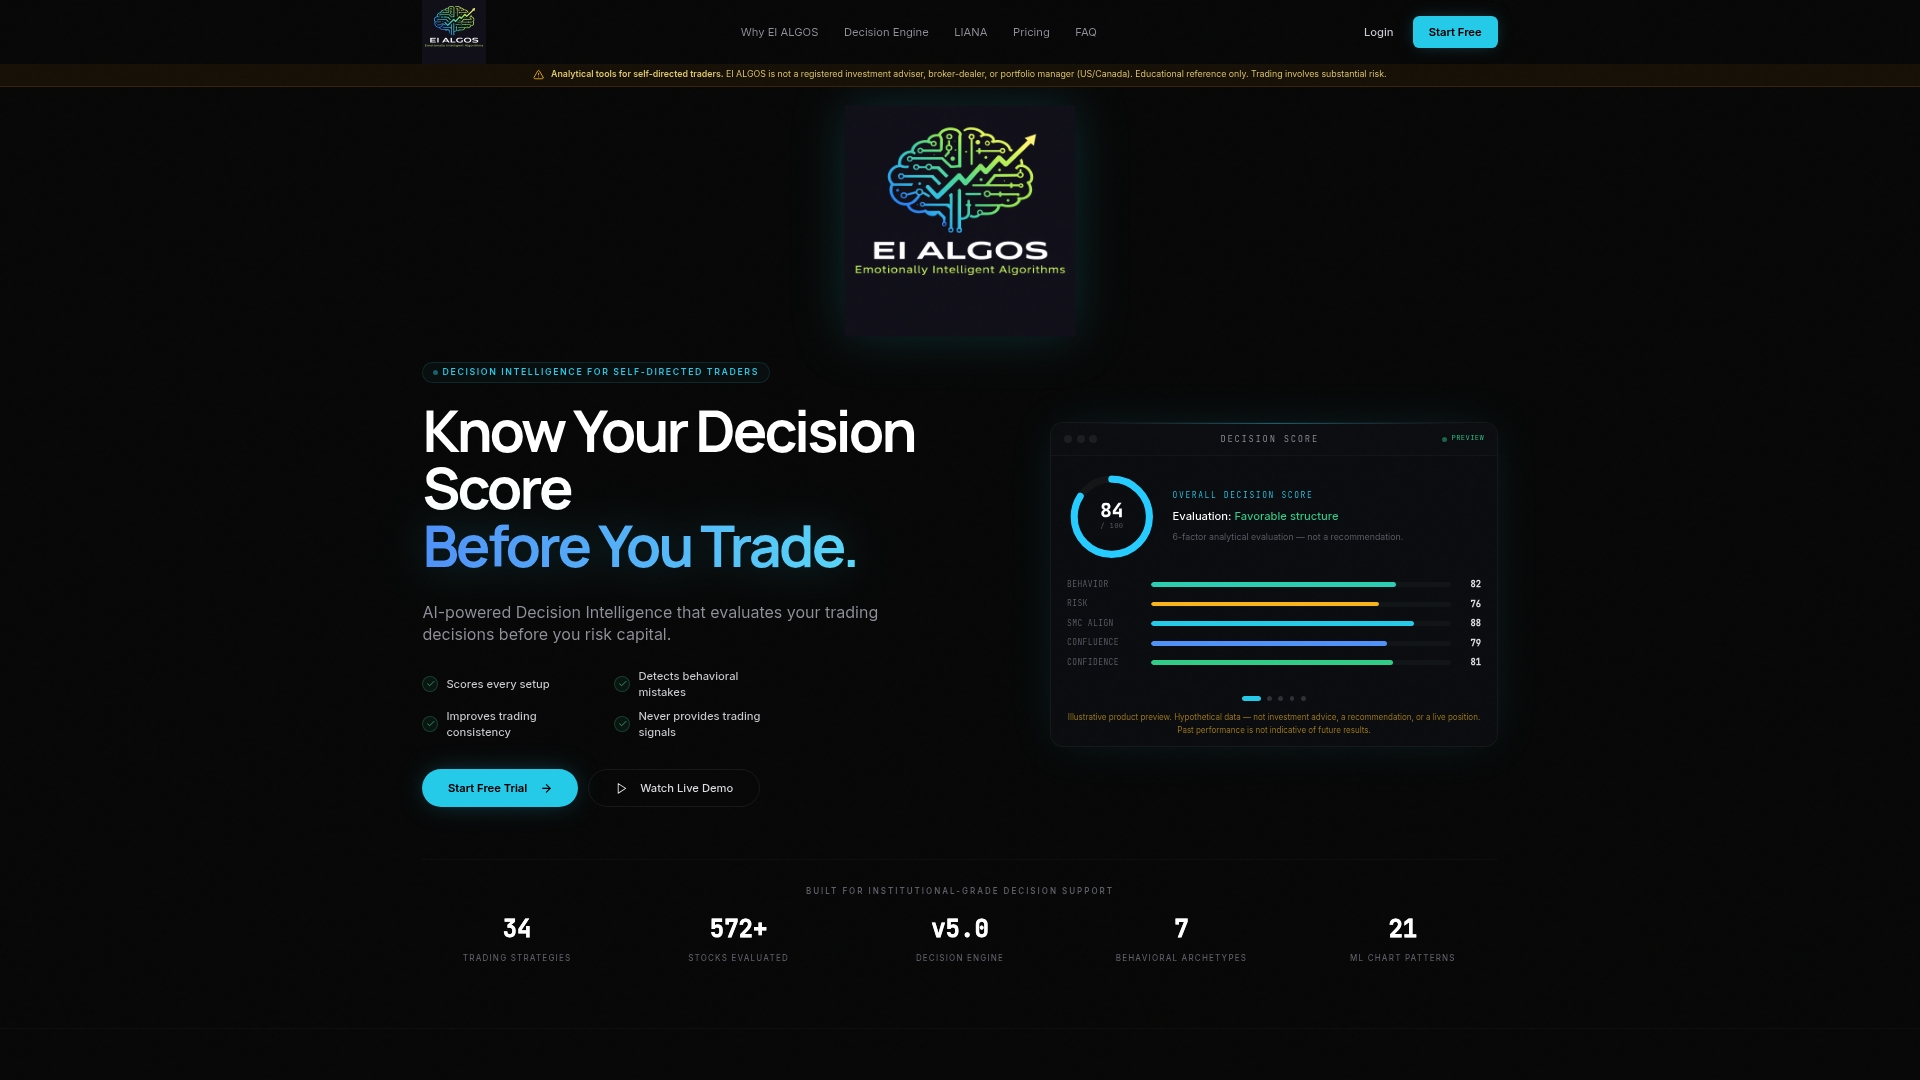
That combination plugs directly into the steps above: run a 30-day behavioral analysis, log rule edits instead of losing track of them, and get alerted when your decision patterns start drifting before your account does. We offer Free, Starter, Pro, and Elite plans, so you can start with the diagnostics that matter most to you. Visit EI ALGOS to see which plan fits your trading.
FAQ
What is drift on Solana?
Drift on Solana usually refers to a decentralized derivatives exchange built on the Solana blockchain, which is unrelated to strategy drift in trading. If you are researching strategy drift, the diagnostics and controls above apply regardless of which market or platform you trade on.
Which trading strategy is best?
There is no single best strategy; what matters more is whether a strategy's live performance still matches its backtested assumptions across different market regimes. A strategy with a lower Minimum Regime Performance is less durable than one with a modest but consistent return across regimes, even if its average Sharpe ratio looks higher.
How did one trader make a very large sum in a short time?
We don't have a verified source describing this specific event, so we can't confirm the details. Extraordinary short-window results are not representative of sustainable trading outcomes and should be treated with caution rather than used as a benchmark.
Can I make a fixed daily profit from trading?
Daily profit targets depend heavily on account size, risk per trade, and strategy edge, and no fixed figure applies to every trader. Sound risk management, including position sizing and stop-loss discipline, matters far more to long-term outcomes than chasing a specific daily number.
How often should I check for strategy drift?
A practical cadence is daily alerts for outlier trades, a weekly performance review, and a monthly regime audit using tools like change-point detection. This layered schedule catches both sudden breaks and slow erosion without requiring constant manual monitoring.
Sources
- Measuring Strategy-Decay Risk: Minimum Regime Performance and the Durability of Systematic Investing
- Can LLM-based Financial Investing Strategies Outperform the Market in Long Run?
- Risk management for active traders
- Trade and Risk Management