
Behavioral trading analysis is the practice of studying the psychological patterns behind your trading decisions, like fear, overconfidence, and loss aversion, to spot the habits that quietly drain your returns. Done well, it helps you catch costly biases before they repeat and build steadier, more consistent decisions. A growing body of research, including Behavioral Performance Attribution models, backs this approach, and platforms like EI ALGOS now apply it directly to live trading.
TL;DR:
- Retail order imbalance can predict returns briefly under some weighting methods, but retail traders remain unprofitable on average as attention driven buying concentrates losses.
- Track your realized gain rate, average holding times for winners and losers, trade frequency, and ticker concentration; flag spikes after losses or news.
- Test one rule at a time, such as pausing ten minutes after a stop, and compare the same metrics over four to eight weeks.
- A six factor score checks factors such as position sizing and timing after losses; it supports your setups rather than predicting prices or issuing signals.
Table of Contents
- What Causes Poor Trading Decisions? The Core Biases to Know
- What Does the Research Say About Retail Trading Behavior?
- How Do You Measure and Change Your Trading Behavior?
- Can a Scoring System Turn Behavior Into Clear Decisions?
- How Do Emotions Shape Trading Decisions?
- How Does the Market Environment Affect Trading Behavior?
- What Technology Helps Detect Behavioral Bias in Trading?
- How Does Behavioral Analysis Fit With Technical and Fundamental Work?
- What Do Real Trading Scenarios Show About Behavioral Bias?
- Why Process Beats Prediction in Behavioral Trading
- Try EI ALGOS to Put Behavioral Analysis Into Practice
- FAQ
- Sources
What Causes Poor Trading Decisions? The Core Biases to Know
Classical finance assumes you act rationally, weighing information and choosing the option with the best expected value. Behavioral finance studies what actually happens: you anchor to past prices, overweight recent losses, and let emotion override your own rules. Behavioral trading analysis takes that research and applies it to your personal trade history so you can see your own patterns instead of someone else's averages.
A handful of biases show up again and again in retail accounts:
- Disposition effect: selling winning positions too early while holding losers far too long, hoping they recover.
- Overconfidence and overtrading: trading more often than your edge justifies because you overestimate the precision of your own analysis.
- Loss aversion (myopic loss aversion): checking positions too frequently and reacting to short-term swings that would not matter on a longer horizon.
- Herd and attention bias: buying into stocks because they are heavily discussed or showing unusual volume, not because the setup supports it.
- Home or familiarity bias: concentrating trades in a narrow set of stocks or sectors you already recognize, which limits diversification.
These are not abstract labels. The SEC's investor bulletin catalogs behaviors like these as measurable drags on performance, and recommends process discipline as the practical countermeasure. Once you can name the bias, you can measure how often it shows up in your own trade log, which is the first real step toward reducing it.
What Does the Research Say About Retail Trading Behavior?
Academic evidence on retail trading is consistent on a few points, even when the mechanisms are debated. The disposition effect is one of the most replicated findings in the field: investors sell winners faster than losers, and that pattern holds across experimental and field datasets.
A Behavioral Performance Attribution framework can explain a significant portion of performance variance in retail trading datasets, generally ranging between roughly forty and sixty percent, meaning bias driven actions, not market conditions alone, account for a large share of why some traders underperform others with similar access to information.
Three patterns matter most for your own analysis:
- Realized gains can distort your self-assessment: counting wins and losses the way the disposition effect encourages feeds overconfidence and more trading.
- Retail order imbalance can positively predict short-term returns under certain weighting schemes, yet retail trades are unprofitable on average because attention-driven buying concentrates losses in high-volume names.
- Overconfidence remains the most cited driver of excessive trading, with traders overestimating the precision of their information and trading past the point where it helps.
Taken together, this evidence points to a practical conclusion: the behaviors that hurt you most are specific, repeatable, and visible in your own trade history if you know where to look.
How Do You Measure and Change Your Trading Behavior?
Turning behavioral finance into a personal practice takes four steps: collect your data, compute a small set of metrics, attribute performance to behavior, and run focused experiments.
- Collect: export your full trade history from your broker, including entry and exit timestamps, position size, and account balance over time.
- Compute core metrics: calculate your realized-gain rate (percentage of winners closed versus losers closed), average holding time for winners versus losers, trades per week or month (turnover), and a concentration index showing how much of your activity sits in a handful of tickers.
- Spot clustering: flag periods where trade frequency spikes right after a loss or a piece of news, since clustering often signals an emotional reaction rather than a planned setup.
- Attribute: apply a simplified Behavioral Performance Attribution approach, comparing your actual returns to what a rules-based version of your own strategy would have produced, to estimate how much of the gap comes from bias rather than market conditions.
- Act: design one small experiment at a time rather than overhauling your whole process at once.
A few experiments consistently help traders working through this framework. A pre-trade checklist that forces you to state your thesis and exit plan before entering cuts impulsive entries. A hard size limit on any trade taken within an hour of a loss reduces revenge trading. A cooling-off rule, such as a mandatory ten-minute pause after a stop-out, interrupts the emotional spiral that often leads to the next bad trade. Rule-based exits, set before you enter rather than decided in the moment, directly counter the disposition effect.
Run each experiment over a fixed window, four to eight weeks works well, and compare your metrics before and after. If your realized-gain rate shifts or your holding-time gap between winners and losers narrows, the experiment is working.
Pro Tip: Track one metric change at a time; mixing several experiments in the same window makes it impossible to tell which one actually moved your numbers.
Can a Scoring System Turn Behavior Into Clear Decisions?
A six-factor scoring approach gives you one concrete way to operationalize this kind of analysis without building your own attribution model from scratch. Instead of generating a buy or sell signal, a system like this evaluates the setup itself: position sizing relative to your account, recent trading frequency, proximity to a prior loss, concentration in a single ticker, and a few other process-level factors that correlate with bias driven decisions.
A six-factor analytical engine can score the decision process behind a trade, and an assistant can turn that score into specific suggestions, for example, flagging overtrading and suggesting a smaller position size before you click submit.
- A scoring engine works best as a check on process, not a replacement for your own judgment.
- Personalized feedback converts a raw metric (like turnover) into a specific next action (like a size cap).
- You can replicate a simplified version of this in a spreadsheet: score each trade one to five on sizing discipline, timing relative to losses, and thesis clarity, then track your average score against your returns over time.
How Do Emotions Shape Trading Decisions?
Fear and excitement change the questions you ask yourself before you click buy or sell. Under stress, you tend to narrow your focus to the most recent price move and discount the broader context you would otherwise weigh. That narrowing is part of why myopic loss aversion pushes you to check positions and react to noise far more than a longer time horizon would justify.
Psychological state also shapes risk tolerance in ways that are not symmetric. A string of losses often triggers either excessive caution, sitting out trades you would normally take, or its opposite, revenge trading to recover the loss quickly. Both responses come from the same emotional root: the discomfort of a realized loss outweighs the discomfort of a missed opportunity, which is loss aversion in practice.
Fatigue and overconfidence interact as well. Traders who have had a good run often loosen their own rules, taking larger positions or skipping their checklist because recent wins feel like proof of skill rather than a mix of skill and circumstance. That overconfidence is one of the clearest, most measurable links between emotional state and the trading metrics covered earlier: turnover tends to rise right after a winning streak, not after a loss.
Recognizing the emotional trigger in the moment is harder than reviewing it after the fact. That is why a trade log that captures your emotional state alongside the numbers (rushed, confident, anxious, bored) gives you a second data point to cross-reference against your realized-gain rate and clustering metrics.

How Does the Market Environment Affect Trading Behavior?
Volatility changes how your biases show up. In calm markets, overconfidence tends to build quietly: fewer surprises make your recent wins feel more like skill, and turnover creeps up. In volatile markets, loss aversion takes over more visibly, with faster exits on small drawdowns and a tendency to abandon your plan at the first sign of trouble.
News flow and attention driven buying interact directly with market conditions. Stocks that see a sudden spike in volume or headline coverage attract a wave of retail buying, and the research on retail order imbalance shows this attention driven activity concentrates losses in exactly those high-volume names, even though the same buying can briefly push short-term prices in a predictable direction.
Liquidity conditions matter too. In thinner markets, slippage and wider spreads amplify the cost of impulsive entries and exits, which means the same behavioral mistake (chasing a breakout, panic-selling a dip) costs more in a low-liquidity environment than in a deep one.
Macro events add another layer. Earnings season, rate decisions, and geopolitical headlines compress decision time, which tends to push traders toward faster, less deliberate choices. If you know a high-volatility window is coming, such as a Federal Reserve announcement, tightening your size limits and checklist discipline in advance is more effective than trying to stay calm in the moment.
What Technology Helps Detect Behavioral Bias in Trading?
Spreadsheets remain a solid starting point, but a few categories of tools make bias detection faster and more consistent. Trade journaling software that automatically tags trades by holding time, size, and sequence (win streak or loss streak) removes the manual work of spotting clustering.
Attribution style analytics take this further by comparing your actual returns against a rules based benchmark built from your own history, which is the practical version of the Behavioral Performance Attribution approach covered earlier. Academic work recommends focusing on a short list of measurable bias factors, including disposition effect, under-diversification, trend chasing, and trade clustering, rather than trying to track every possible bias at once.
Machine learning based platforms add a layer that simple spreadsheets cannot: pattern detection across hundreds of your own past trades to flag a developing habit, like a rising tendency to add to losing positions, before it shows up clearly in a monthly summary. A system that scores each setup on process factors, as covered in the six-factor example earlier, is one applied version of this.
Whatever tool you use, the goal stays the same: convert a vague sense that "I trade too much after a loss" into a specific, trackable number you can watch change over time.
How Does Behavioral Analysis Fit With Technical and Fundamental Work?
Behavioral trading analysis is not a replacement for technical or fundamental analysis. It is a check on how consistently you execute whichever method you already use. A trader with a sound technical setup can still lose money if loss aversion causes early exits on winners and extended holds on losers, undoing the edge the setup was supposed to provide.
Pairing behavioral metrics with fundamental research adds another layer of discipline. If your turnover and clustering numbers show you are prone to attention driven buying, cross-checking a stock's valuation or disclosure quality before entering can slow you down enough to avoid the trade. Forensic, evidence based scoring approaches, like the kind covered in this forensic toolkit on market mispricing, give you a concrete, non-behavioral data point to weigh against a trade idea that feels urgent but has not been fully researched.
The combination works best as a sequence: let your technical or fundamental process generate the idea, then run it through a behavioral check, position size relative to recent losses, thesis clarity, timing, before you execute. That order matters because behavioral checks applied after a trade already feels emotionally locked in rarely change the outcome.
What Do Real Trading Scenarios Show About Behavioral Bias?
Consider a trader who closes winning positions within a day or two but holds losing positions for several weeks, hoping for a recovery. Measured over a quarter, this pattern shows up clearly as a wide gap between average winning and losing holding times, a textbook disposition effect signature that the original Odean research first documented in large brokerage datasets.
A different pattern shows up around earnings season: a trader whose trade frequency doubles in the days following a widely covered stock move, chasing volume rather than a planned setup. Reviewing that trader's win rate on attention driven trades against their win rate on planned setups typically shows a meaningful gap, consistent with the research on retail order imbalance and concentrated retail losses.
A third scenario involves a trader coming off a strong month who gradually increases position size without adjusting their stop-loss discipline. The resulting drawdown often erases several months of gains in a single bad week, a pattern consistent with overconfidence research showing that recent wins encourage looser risk controls rather than tighter ones.
In each case, the fix is the same: isolate the specific metric that reveals the bias (holding time gap, win rate by trade trigger, position size trend) and design one experiment that targets it directly, rather than trying to overhaul the whole trading process at once.
Why Process Beats Prediction in Behavioral Trading
Behavioral trading analysis will not hand you a forecast, and treating it that way sets you up for disappointment. Its real value is narrower and more useful: a steady way to catch the habits that cost you money and replace them with rules you can measure. Set modest goals, like closing the gap between your winning and losing holding times, and let a trading journal and a few small experiments do the rest.
— Anantha
Try EI ALGOS to Put Behavioral Analysis Into Practice
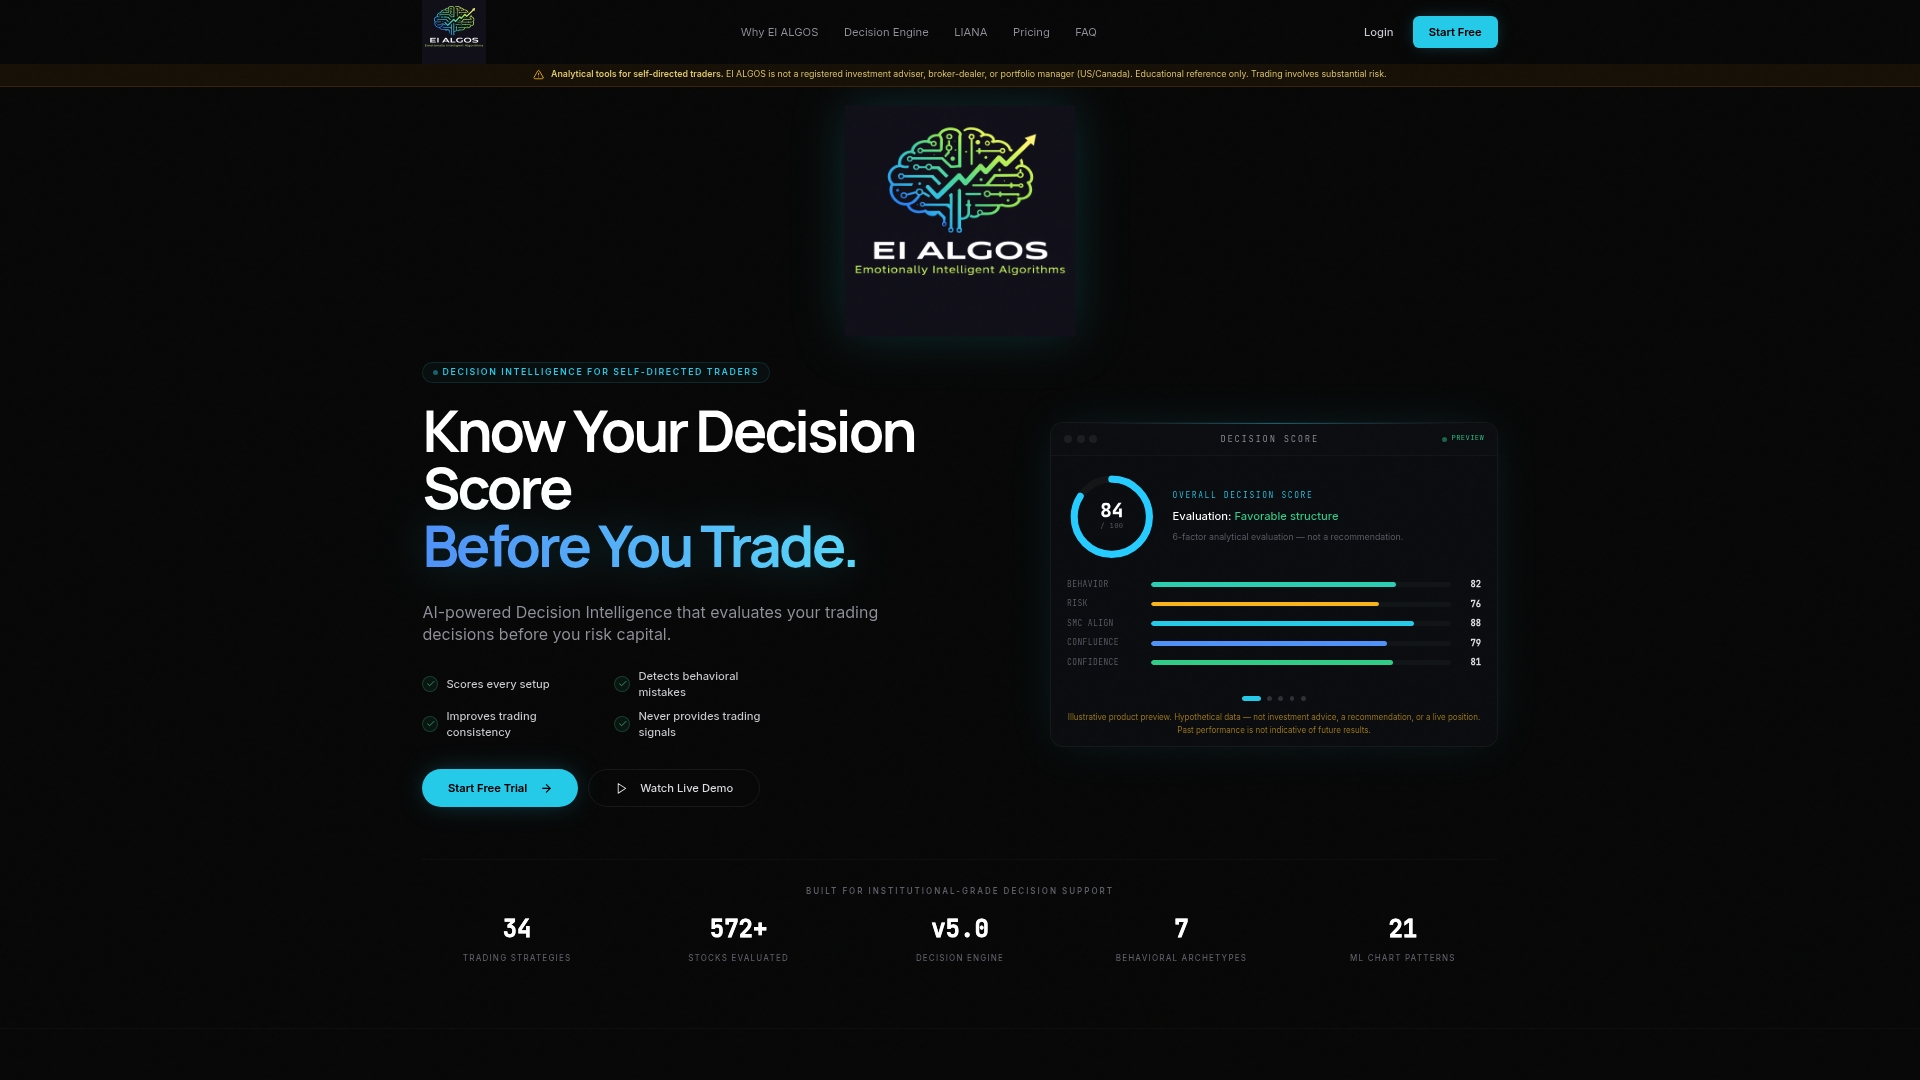
If you want to apply this kind of analysis without building your own spreadsheet from scratch, EI ALGOS offers a Decision Intelligence platform built specifically for self-directed traders. Rather than generating signals, it scores the decision process behind each setup using a six-factor engine, flags behavioral mistakes as they happen, and uses its LIANA assistant to turn those patterns into specific, personalized suggestions.
A good first test: run a 30-day measurement of your realized-gain rate alongside one behavior experiment, like a size cap after a loss, and see which metric moves.
- Best suited to traders who already execute their own setups and want a process-level check, not a signal provider.
- Works alongside whatever technical or fundamental method you already use.
- Various subscription plans are available; current prices can be found on the provider's website.
FAQ
What is Warren Buffett's 70/30 rule?
The 70/30 rule commonly attributed to Warren Buffett refers to allocating roughly 70% of a portfolio to lower-risk, diversified holdings and 30% to more growth-oriented or opportunistic positions. Definitions vary across sources, so treat it as a general allocation heuristic rather than a fixed formula, and confirm specifics against a qualified advisor before applying it to your own portfolio.
What is the 3-5-7 rule in trading?
It is a popular heuristic for position sizing rather than a figure drawn from formal academic research.
Does behavioral finance pay well?
Behavioral finance as a career field, including roles in academia, asset management, and consulting, can offer competitive compensation, though specific pay figures depend heavily on employer, role, and location and are not something this article can state as a single number. For traders applying behavioral finance to their own accounts rather than as a career, the payoff shows up as reduced costly trades and more consistent execution rather than direct income.
How does EMH affect stock prices?
The efficient market hypothesis (EMH) holds that stock prices already reflect available information, which implies prices should adjust quickly to new data and resist consistent prediction. Behavioral trading analysis exists partly because real markets deviate from strict EMH predictions, as research on retail order imbalance shows short-term predictability coexisting with average retail underperformance.
What does EI ALGOS actually score when I place a trade?
EI ALGOS scores the decision process behind a trade setup using a six-factor analytical engine, covering things like sizing discipline and timing relative to recent trades, rather than predicting where the price will go next. The platform does not provide trade signals or recommendations; it is built to help you see your own behavioral patterns.