
Backtesting routinely overstates live performance because of a short, detectable list of errors: survivorship bias, look-ahead bias, overfitting, ignored execution costs, cherry-picked periods, data quality failures, and unrealistic fill assumptions. Your single next action is to reserve a strict held-out out-of-sample window you have never touched, run your strategy on it, and report the resulting Sharpe ratio after deflating for the number of trials you ran. If the OOS Sharpe drops by more than half relative to the in-sample figure, the strategy is not ready. That one test filters out the majority of false discoveries before a dollar of live capital is at risk.
Key Takeaways
The most reliable path from a promising backtest to consistent live performance requires eliminating each of the seven pitfalls above, validating with CPCV or walk-forward analysis, and adding a behavioral decision gate before deploying capital.
| Point | Details |
|---|---|
| Use survivorship-free, point-in-time data | Survivorship bias can inflate equity returns by a small but meaningful annual amount |
| Never use random K-fold on time-series data | Purged/embargoed K-fold or CPCV is required to avoid serial-correlation leakage. |
| Model full execution costs before trusting results | Commissions, spread, slippage, and market impact can halve apparent returns for active strategies. |
| Reserve and protect your OOS window | Once you look at OOS results and retune, that window is contaminated and no longer a valid test. |
| Eialgos adds the behavioral layer backtests miss | The platform's six-factor scoring and LIANA assistant detect execution-phase behavioral errors that numeric validation cannot capture. |
Table of Contents
- What are the core backtesting pitfalls you need to fix first?
- What data problems silently wreck your backtest?
- How do overfitting and multiple testing corrupt your results?
- How do you model execution realistically in a backtest?
- A reproducible robustness checklist before you go live
- How does decision intelligence reduce execution risk beyond the numbers?
- The mistake practitioners keep repeating
- Eialgos complements your validation process with behavioral scoring
- Sources
What are the core backtesting pitfalls you need to fix first?
Every strategy developer eventually faces the same rude shock: a backtest that looked exceptional in development produces flat or negative returns in live trading. The gap is almost never random. It traces back to one or more of the following seven errors, each of which inflates in-sample metrics in a predictable, correctable way.
1. Survivorship bias
Definition. Your historical universe contains only the securities that still exist today. Companies that delisted, went bankrupt, or were acquired are absent, so the backtest trades only winners by construction.
Impact. Survivorship bias can inflate equity returns by a small but meaningful annual amount in some studies and often a low percentage for equity-focused backtests. Over a 10-year test, that compounds into a meaningfully distorted equity curve.
Mitigation checklist:
- Use a point-in-time universe file that records which tickers were in the index or tradeable on each historical date.
- Include delisting returns (typically negative) for every removed security.
- Verify that your data vendor explicitly labels its dataset as survivorship-free.
2. Look-ahead / forward-looking bias
Definition. The strategy uses information that was not available at the time the trade would have been placed. Common sources include earnings figures published after market close being used on the same day, adjusted prices that embed future splits, and index membership known only in hindsight.
Impact. Even a one-day timestamp error on a fundamental data point can produce an apparently profitable signal that is entirely fictitious. The equity curve looks smooth because the strategy is effectively trading on tomorrow's news.
Mitigation checklist:
- Align every data point to its actual publication timestamp, not its reference date.
- Use raw (unadjusted) prices for signal generation; apply split/dividend adjustments only to returns, not to the price series used for entry logic.
- Run a timestamp audit: check that no signal fires before the data it depends on was publicly available.
3. Overfitting, data-snooping, and multiple testing
Definition. Running dozens or hundreds of parameter combinations on the same dataset guarantees that at least one configuration will look profitable by chance. This is sometimes called curve fitting in trading or p-hacking.
Impact. Overfitting and undisclosed trial counts make many reported backtests unreliable. A short backtest combined with a large parameter search is especially dangerous: the Minimum Backtest Length (MinBTL) concept formalizes how few trials it takes to fabricate a high in-sample Sharpe when true edge is zero.
Mitigation checklist:
- Pre-register your hypothesis and parameter ranges before running any backtest.
- Track the total number of trials (N) and compute a deflated Sharpe ratio that penalizes for N.
- Require at minimum 100 independent trades per free parameter in your model.
- Reserve a strict OOS window before any development begins and never touch it until the final validation step.
4. Ignoring transaction costs, slippage, and market impact
Definition. The backtest assumes trades execute at the closing price (or mid-price) with zero friction. In live trading, you pay commissions, cross the bid-ask spread, move the market with your order, and sometimes miss fills entirely.
Impact. Realistic execution assumptions can materially reduce Sharpe ratios and net returns, often halving apparent returns for higher-frequency strategies. A strategy with a gross Sharpe of 1.5 can easily become a net Sharpe below 0.5 once a realistic cost model is applied.
Mitigation checklist:
- Add a per-trade cost model: commission + half-spread + a slippage allowance scaled to average daily volume (ADV).
- For strategies trading more than 1% of ADV, apply a square-root market impact model.
- Stress-test costs at 2× and 3× your baseline estimate to see where the strategy breaks.
5. Cherry-picked or unrepresentative sample periods
Definition. The backtest covers only a bull market, only a low-volatility regime, or only the period during which the strategy's logic happened to work. Regime dependence is invisible until the market shifts.
Impact. A momentum strategy backtested exclusively on 2010–2021 U.S. equities will look exceptional. The same strategy applied to 2022 or to a sideways market in 2015–2016 often collapses. The backtest is not measuring edge; it is measuring regime fit.
Mitigation checklist:
- Span at least two full market cycles, including at least one significant drawdown period.
- Segment performance by volatility regime (VIX quartiles, for example) and by trend/mean-reversion environment.
- Run the strategy on an out-of-region or out-of-asset-class dataset as a robustness check.
6. Data quality failures
Definition. Errors in the raw data, including backfilled prices, incorrect corporate action adjustments, missing delisting records, and mismatched tick-to-OHLC aggregations, introduce noise and subtle look-ahead leaks.
Impact. Data quality issues such as incorrect timestamps, backfill, and index membership errors can introduce subtle look-ahead bias and must be caught with specific validation tests before any results are trusted.
Mitigation checklist:
- Check for sudden jumps in universe counts across dates (a sign of backfill or membership errors).
- Flag zero-volume days, impossible prices (negative or orders-of-magnitude outliers), and NaN frequencies above a threshold.
- Validate that OHLC bars are internally consistent: High ≥ Open, Close, Low; Low ≤ Open, Close, High.
7. Unrealistic execution assumptions
Definition. The backtest assumes instantaneous fills at the signal price, ignores latency between signal generation and order submission, and treats all orders as fully filled regardless of liquidity.
Impact. In live trading, a signal generated at bar close may not reach the exchange for 50–500 milliseconds, by which time the price has moved. Partial fills on thinly traded names mean the strategy's actual position size differs from the modeled size, distorting both returns and risk metrics.
Mitigation checklist:
- Model a realistic order submission delay (even a one-bar lag for daily strategies is a meaningful improvement).
- Cap position size at a fixed fraction of ADV (commonly 5–10%) to avoid modeling fills that cannot realistically occur.
- Use next-bar open prices for fill simulation on daily strategies rather than the signal bar's close.
Practical mitigations including point-in-time data, realistic slippage modeling, and walk-forward analysis consistently close the gap between backtest and live results across practitioner guides.
What data problems silently wreck your backtest?
Data errors are the most underestimated source of backtest inflation because they are invisible in the equity curve. A strategy can look clean and well-validated while sitting on a foundation of corrupted inputs.
Point-in-time vs. revised data
Fundamental databases (earnings, revenue, balance sheet items) are frequently restated after initial publication. A database that stores only the final, revised value makes it appear as though the revised figure was available on the original report date. That is a form of look-ahead bias. Point-in-time databases store every vintage of a data point, keyed to the date it was first published. For any fundamental or macro signal, point-in-time data is not optional.
Backfill and index membership errors
When a new security is added to an index, some data vendors backfill its historical price and fundamental data as if it had always been in the universe. A strategy that trades index constituents will then appear to have traded that security before it was actually eligible, capturing returns that were never available.
Corporate actions and price adjustments
Stock splits, dividends, spin-offs, and mergers require careful price adjustment. Worse, some adjustment schemes embed future information into the adjusted price series used for signal generation.
The table below maps the most common data symptoms to their likely causes and the standard remediation.
| Symptom | Likely cause | Remediation |
|---|---|---|
| Universe count spikes on a single date | Backfill or index rebalance error | Use point-in-time membership files |
| Overnight price gap exceeding 25% | Unadjusted stock split | Apply split factor; validate with raw share count |
| Fundamental value available before earnings date | Revised data stored without vintage | Switch to point-in-time fundamental feed |
| Zero volume for multiple consecutive days | Delisted or halted security not flagged | Include delisting flags and terminal returns |
| Tick-to-OHLC mismatch | Aggregation timezone error | Validate bar timestamps against exchange session hours |
| Negative or extreme price outliers | Data vendor error or bad tick | Apply price sanity bounds; cross-reference secondary source |
Data-validation workflow. Before trusting any backtest result, run these checks in order:
- Plot universe count by date and flag any single-day change exceeding 5% of the total count.
- Compute the distribution of overnight returns and flag any observation beyond ±25% for manual review.
- Check fundamental timestamps against the SEC EDGAR filing date for a random sample of 50 observations.
- Confirm that adjusted close prices reproduce the correct total return when dividends are added back.
- Verify that delisted securities appear in the dataset through their last trading date with a terminal return.
For daily signal strategies, cleaned OHLC data with explicit corporate action logs is the minimum standard. For microstructure or intraday work, raw trade-and-quote data with exchange timestamps is required. Point-in-time fundamental feeds are necessary for any strategy that conditions on balance sheet or income statement data.
How do overfitting and multiple testing corrupt your results?
Overfitting in trading, also called data-snooping or curve fitting, is the single most common reason a backtest fails to replicate in live trading. The mechanism is straightforward: given enough parameter combinations and a fixed dataset, random noise will produce at least one configuration that looks like a genuine edge.
Why standard cross-validation fails on financial data
The independent and identically distributed (IID) assumption underlying random K-fold cross-validation does not hold for financial time series. Returns exhibit serial correlation, volatility clustering, and regime persistence. When you randomly assign observations to folds, training and validation sets share overlapping time windows. A model trained on data from 2018 and validated on a randomly selected 2018 sample has already seen the market conditions it is being tested on. The result is an optimistic validation score that does not reflect true out-of-sample performance.
Random K-fold cross-validation is invalid for time-series trading data; purging, embargoing, and combinatorially symmetric cross-validation (CPCV) are the recommended alternatives to avoid leakage from serial correlation.
A practical validation pipeline
A reproducible validation workflow for a time-series strategy follows this sequence:
- Split the data. Reserve the final 20–30% of your historical data as a strict OOS holdout. Never use it during development.
- Purge overlapping labels. For any label that spans multiple bars (a 5-day forward return, for example), remove observations from the training set whose label window overlaps with the validation window.
- Add an embargo. After the purge boundary, exclude an additional buffer of bars equal to the autocorrelation decay length of your features. A common default is 5 bars for daily data.
- Run CPCV. Combinatorially symmetric cross-validation generates many non-overlapping test paths across the in-sample period, producing an empirical distribution of Sharpe ratios rather than a single point estimate. Strategies with high variance across CPCV paths are unstable regardless of their mean performance.
- Compute the deflated Sharpe ratio. Penalize the observed in-sample Sharpe for the number of trials N and the length of the backtest. A strategy tested across 50 parameter combinations needs a meaningfully higher raw Sharpe to remain significant after deflation.
- Check parameter stability. Vary each parameter by ±20% around the selected value and confirm that performance degrades gracefully rather than collapsing. A strategy whose Sharpe drops from 1.4 to 0.2 when a single parameter shifts by 10% is overfit.
Practical CPCV and purging habits yield an empirical distribution of performance and expose unstable strategies that a single walk-forward path may hide.
Academic research has also proposed specialized metrics, such as path-loss-based measures, for selecting strategy frequency and pairs in ML-based trading that outperform naive in-sample accuracy as selection criteria.
Comparison of validation techniques
| Technique | Leakage risk | Data efficiency | Implementation complexity |
|---|---|---|---|
| Random K-fold | High (invalid for time series) | High | Low |
| Rolling walk-forward | Low | Moderate | Low |
| Purged/embargoed K-fold | Low | Moderate | Moderate |
| CPCV | Very low | High | High |
Pro Tip: Track every parameter combination you test in a trial log. Before running your final OOS test, compute the deflated Sharpe ratio using the total trial count N. If the deflated figure drops below 0.5, the strategy has not cleared the multiple-testing bar regardless of how good the in-sample curve looks.
How do you model execution realistically in a backtest?
Execution costs are not a rounding error. For strategies trading daily or more frequently, they are often the difference between a profitable and unprofitable system. Commissions, bid-ask spreads, slippage, and market impact can materially reduce Sharpe ratios and net returns, often halving apparent returns for higher-frequency approaches.
The four cost components
Commissions. For U.S. equity retail traders, many brokers now offer zero-commission trading on stocks and ETFs, but options still carry per-contract fees. For futures and institutional equity, commissions remain a real line item. Model the exact fee schedule of your target broker.
Bid-ask spread. The spread is the minimum cost of a round trip. For liquid large-cap equities, this is typically 1–2 cents per share. For small-caps or thinly traded options, it can be 5–20 cents or more. Use the half-spread as the cost per side.
Slippage. Even at the quoted spread, large orders or fast-moving markets cause fills to occur away from the mid-price. A simple model adds a slippage allowance equal to a fixed percentile of the historical intraday range, scaled to your order size relative to ADV.
Market impact. When your order represents a meaningful fraction of daily volume, it moves the price against you. A square-root market impact model is a widely used approximation: impact scales with the square root of participation rate.
Fill models and tradeability rules
Stress-test this at 2× to confirm the strategy survives.
For intraday strategies, VWAP-sliced fill models are more appropriate. Assume your order is filled at the VWAP of the execution window, then add a participation-rate penalty.
Reduce position size or filter to more liquid names.
Latency matters most for strategies with holding periods under one hour. For daily strategies, a one-bar execution lag (entering at the next open rather than the signal close) is a sufficient and conservative approximation. For intraday strategies, paper-trade a sample of signals on your target venue before committing capital, specifically to measure the gap between your modeled fill price and the actual fill.
U.S. retail traders should also account for pattern day trader (PDT) rule constraints when modeling intraday execution frequency, as account size requirements directly affect how many round trips are feasible.
A reproducible robustness checklist before you go live
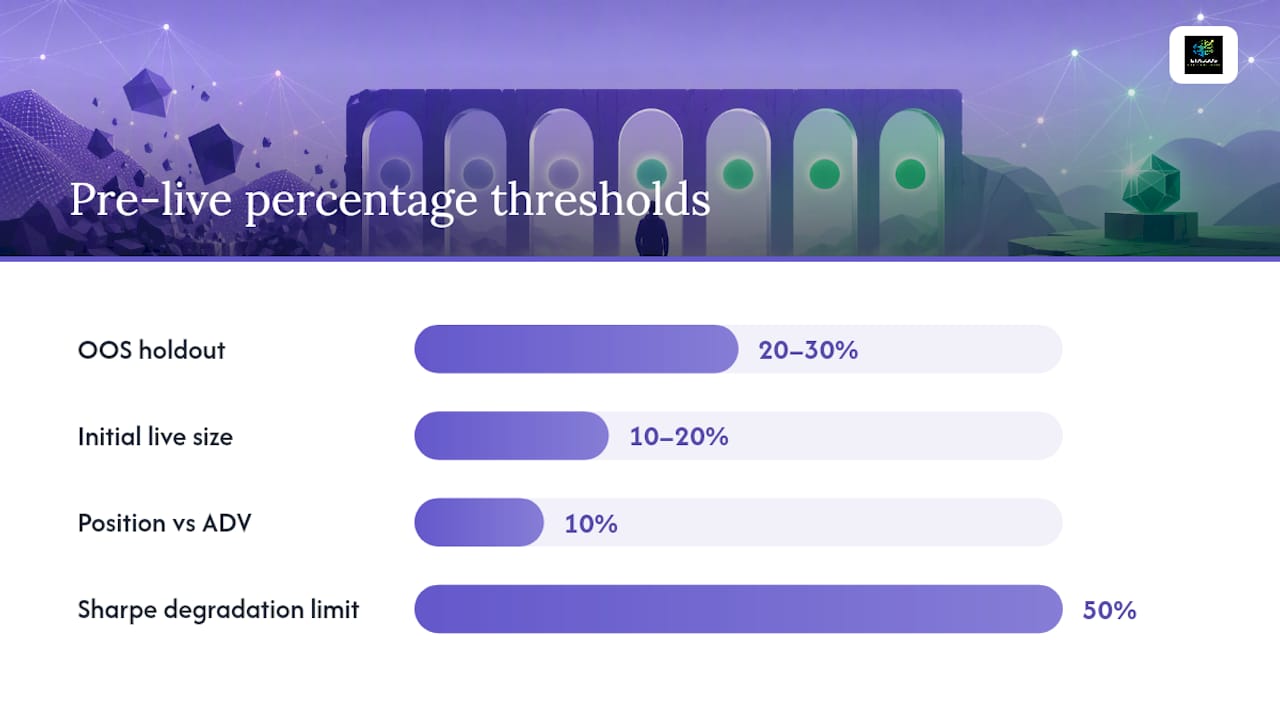
This checklist moves a strategy from concept to small live deployment in a structured sequence. Each gate has a go/no-go criterion. Skipping a gate does not save time; it transfers the cost to live capital.
Phase 1: Pre-research gate
- Write a one-paragraph hypothesis stating the economic rationale for the edge before looking at any data.
- Define your parameter ranges and the maximum number of combinations you will test (cap at 50 for a simple strategy).
- Reserve the final 20–30% of available history as an untouched OOS holdout. Document the exact start date.
- Confirm your data source is survivorship-free and point-in-time for any fundamental inputs.
Phase 2: In-sample design
- Build and optimize the strategy on the in-sample period only.
- Verify that the strategy generates at least 100 trades per free parameter over the in-sample period.
- Run the timestamp and data-quality checks from Section 3 before accepting any results.
- Apply a realistic cost model (commissions + half-spread + slippage) and confirm the strategy remains profitable net of costs.
Phase 3: Statistical validation
- Run purged/embargoed K-fold or CPCV on the in-sample period. Confirm that the Sharpe distribution across paths is positive and reasonably tight.
- Compute the deflated Sharpe ratio accounting for the number of trials tested. Require a deflated Sharpe above 0.5 as a minimum threshold.
- Run a parameter sensitivity map: vary each parameter ±20% and confirm graceful degradation.
- Go/no-go: OOS Sharpe (after deflation) > 0.5, parameter stability confirmed, no single parameter dominates performance.
Phase 4: OOS validation
- Run the strategy on the held-out OOS window exactly once. Record the result without further modification.
- Compare OOS Sharpe to in-sample Sharpe. A degradation of more than 50% is a red flag requiring investigation before proceeding.
- Segment OOS performance by market regime (trending vs. mean-reverting, high vs. low volatility). Confirm the strategy does not rely on a single regime.
Phase 5: Execution modeling and paper trading
- Apply the full execution cost model (including market impact at your expected position size).
- Paper-trade the strategy for a minimum of 30 signals on your target venue to validate fill assumptions.
- Confirm that expected position sizes stay within 10% of ADV for all target securities.
Phase 6: Small live rollout
- Deploy at 10–20% of intended position size for the first 60 trading days.
- Track live Sharpe vs. backtest Sharpe weekly. If live Sharpe falls below 50% of the OOS figure after 60 days, pause and investigate.
- Maintain a full trial log and performance record consistent with SEC guidance on recordkeeping and transparency for investment practices.
Your action today: Reserve your OOS window and run CPCV or a rolling walk-forward on the in-sample period. Do not run the OOS test until every in-sample gate above is cleared.
How does decision intelligence reduce execution risk beyond the numbers?
Statistical validation catches model errors. It does not catch the moment you override your stop-loss because you "feel" the trade will recover, or the morning you size up three times your normal position after a winning streak. Those behavioral lapses create performance leakage that no backtest can measure, because they are not in the backtest at all.
Decision intelligence addresses this gap by scoring the quality of each trading decision before and during execution, independent of the trade's outcome. The core idea is that a good process, applied consistently, produces better long-run results than an inconsistent process applied to a good model.
Here is how a decision-intelligence layer complements the validation checklist above:
- Pre-trade decision scoring. Before entering a position, a decision score evaluates whether the setup meets your pre-defined process criteria: signal clarity, risk/reward alignment, position sizing discipline, and timing. A score below your threshold is a gate, not a suggestion.
- Behavioral error detection. Patterns such as revenge trading, overtrading after drawdowns, and position-size drift are detectable in trade logs. Flagging them in real time prevents a single bad session from compounding into a drawdown that the backtest never modeled.
- Process journaling. Capturing the decision context (market conditions, emotional state, rationale) alongside the trade data creates a feedback loop that pure P&L tracking cannot. Over time, you can identify which decision conditions correlate with your best and worst live outcomes.
- Automated gating. A decision gate that must be cleared before a signal is acted on enforces the same discipline as a pre-registered hypothesis in backtesting. It prevents the live equivalent of data-snooping: acting on a signal that does not meet your own process standards.
Eialgos builds this layer into its Decision Intelligence platform for self-directed traders. The platform's six-factor analytical engine scores each trade setup on behavioral and process dimensions, and the LIANA assistant provides personalized feedback on decision patterns over time. For traders who have completed the statistical validation checklist, adding a decision-scoring workflow closes the behavioral gap between a validated model and consistent live execution.
Journaling tools that capture decision metadata, such as those compared in Tradervue vs. TraderSync, are a practical starting point for instrumenting this layer before moving to a full decision-intelligence platform.
A process-oriented trading approach that combines statistical rigor with behavioral discipline is the closest thing to a durable edge that self-directed traders can build and maintain over time.
The mistake practitioners keep repeating
The most common pattern I see in strategy development is not a technical failure. It is a sequencing failure. A developer builds a strategy, optimizes it carefully, runs a walk-forward test, sees a decent OOS result, and then immediately begins tweaking parameters to improve that OOS result. At that point, the OOS window is no longer out-of-sample. It has become another in-sample period, and the developer has unknowingly started a second round of overfitting on what they believe is a clean test.
The lesson is simple but hard to follow under the pressure of wanting a strategy to work: the OOS window is sacred. Once you look at it, it is contaminated. If the first OOS result is disappointing, the correct response is to go back to the hypothesis, not to the parameters. Adjust the model logic based on economic reasoning, re-optimize on the in-sample data, and then test on a new, previously untouched data period. If you have run out of untouched data, the strategy needs more history or a fundamentally different approach.
The habit change that prevents this: write down the OOS start date and the OOS result in a permanent log before you do anything else. That record makes it psychologically harder to rationalize a second look.
Eialgos complements your validation process with behavioral scoring
Statistical validation gets you to the starting line. What happens after you go live depends on execution discipline, and that is where most validated strategies leak performance.
Eialgos is built for exactly this phase. The platform scores each trade setup across six behavioral and process dimensions before you act, so your live execution reflects the same rigor as your backtesting process. The LIANA assistant tracks your decision patterns over time and surfaces the specific behavioral errors, such as oversizing, early exits, and signal-chasing, that erode returns in ways no backtest can capture. You do not get signals. You get a clear read on whether your decision meets your own process standard.
The free tier gives you immediate access to decision scoring and process tracking. Paid plans unlock unlimited setups, advanced pattern detection, and full LIANA feedback. Start with the free plan on the Eialgos subscription page and add the behavioral layer your backtest cannot provide.
Sources
The sources below are the most useful references for traders and quant developers who want to go deeper on backtesting methodology, statistical validation, and regulatory standards.
- 8.3 The Dangers of Backtesting | Portfolio Optimization
- Your Backtest Probably Lies — The 4 Biases That Break Live P&L | Quant Decoded
- How To Avoid Bias in Backtesting | For Traders
- Sec
This article is general information, not a substitute for advice from a qualified financial advisor. Consult a qualified financial professional about your own circumstances before acting on anything here.