
Volatility regime trading means classifying markets into measurable states, low, mid, high, or extreme, and letting that classification drive your tactics and position size rather than guessing at direction. You detect the regime using realized-volatility percentiles, VIX zones, or Hidden Markov Models, then match your trade structure and risk budget to what the regime actually supports.
TL;DR:
- Rank current annualized realized volatility against its trailing history; readings above the 80th percentile indicate high volatility, while those below the 20th indicate low volatility.
- A VIX spike that fades within two sessions may favor mean reversion, while elevated volatility lasting weeks calls for smaller positions and protection.
- Low volatility favors premium collection, while high or extreme conditions favor hedges or staying small; continuous sleeve weighting can reduce whipsaw and turnover.
- Before trading, test out of sample, confirm sleeve returns vary consistently with prior regime probabilities, and include switching costs and negative VIX futures roll yield.
Table of Contents
- What Volatility Regimes Are and Why They Change Trade Choice
- How to Detect Regimes: Indicators, Models, and Cross-Asset Confirmation
- Regime-Specific Tactics and Concrete Strategy Outlines
- Risk Controls and Implementation Traps
- How to Validate a Regime Signal Before You Trade It
- How a Decision-Intelligence Platform Helps You Apply Regime Signals
- Where Regime Trading Fits in a Retail Quant's Toolbox
- Try a Process-First Way to Trade Regimes
- FAQ
- Sources
What Volatility Regimes Are and Why They Change Trade Choice
A regime is a state of the market's volatility behavior, not a single data point. Most practitioners bucket regimes into four operational tiers: low (bottom third of trailing realized-vol percentiles, or VIX in a low range), mid (middle range in VIX level), high (higher range in VIX), and extreme (VIX at a very high level, often tied to systemic stress). The threshold matters less than consistency: pick a lookback and stick with it.
What changes the trade is persistence, not the level itself. A VIX print of 28 that fades back under 20 within two sessions behaves nothing like a VIX of 28 that holds for two weeks. The first is noise worth fading with defined risk; the second is a regime shift that demands smaller size and protection-first positioning.
- A single-day spike to a high VIX level typically reverts and favors short-vol, mean-reversion tactics.
- A multi-week stay at an elevated VIX level usually marks a structural regime change that favors long-vol or hedged exposure.
- The same numeric reading can justify opposite trades depending entirely on how long it persists.
How to Detect Regimes: Indicators, Models, and Cross-Asset Confirmation
Detection starts with realized volatility: compute the annualized standard deviation of daily log returns over a rolling window (commonly 10, 20, or 60 days), then rank the current reading against its own trailing history to get a percentile. A reading above the 80th percentile marks a high-vol regime; below the 20th marks low-vol.
- Calculate rolling realized volatility and convert it to a percentile rank against a multi-year lookback.
- Layer in VIX level zones (under 15, 15 to 20, 20 to 30, above 30) as a cross-check against realized vol.
- Read the VIX futures curve: contango (near-term cheaper than later months) signals calm, while backwardation signals acute stress.
- Where rule-based thresholds feel noisy, a Hidden Markov Model can separate latent states and estimate how long each state tends to persist, which adds value mainly when your universe shows genuine state-dependent behavior.
- Confirm with cross-asset signals: widening credit spreads and a rising MOVE index help distinguish a systemic regime shift from an isolated equity move.
Data hygiene matters as much as the model. Use consistent sampling frequency, avoid over-smoothing (which masks regime transitions), and never let your percentile ranking peek at future data, a common look-ahead bias that inflates backtested regime signals.
Pro Tip: Run your regime filter on out-of-sample data first. A signal that only works in-sample is not a regime signal, it is curve fitting.

Regime-Specific Tactics and Concrete Strategy Outlines
Each regime supports a different toolkit, and forcing the wrong tactic into the wrong regime is where most regime-aware traders lose their edge.
- Low-vol regimes favor premium collection, carry strategies, and tighter stops; avoid large directional bets since compressed ranges punish wide targets.
- Mid or fragile regimes call for smaller position sizes, option calendars, and defined-risk spreads, since a breakout can arrive without warning.
- High or stress regimes call for a protection-first posture: long-vol structures or dynamic hedges, while avoiding carry trades that assume calm conditions.
- Extreme regimes often reward staying small and liquid rather than trying to pick a bottom.
A simple implementation is volatility-scaled sizing: divide your base position size by the current realized-vol percentile relative to its historical median, so size shrinks automatically as volatility rises, a practical approach explained well in the Risk of Ruin for Traders guide. For architecture, a continuous sleeve slider, where you weight between a low-vol sleeve and a high-vol sleeve in proportion to regime probability, tends to outperform a discrete all-or-nothing switch because it reduces whipsaw trades, a finding echoed in regime-based strategy research. A minimal hedge can be as simple as adding a small long-vol options position sized to offset a fixed percentage of portfolio delta once the regime filter crosses into the high bucket.
Risk Controls and Implementation Traps
Two frictions quietly erode regime strategies: roll yield and turnover. VIX futures are typically in contango, meaning longer-dated contracts trade above spot. Holding a long VIX futures position in this state creates a negative roll yield, since the contract loses value as it rolls down the curve toward expiration, a dynamic well documented in VIX-linked fund prospectus filings. A rules-based structure, like the one described in the JP Morgan Strategic Volatility Dynamic Index filing, addresses this by staying flat in normal contango markets and only activating protective positioning once backwardation signals genuine stress.
Contango drag is one of the most consistent costs retail traders underestimate in long-volatility products, often eating returns even when the underlying volatility thesis is correct.
- Switching sleeves too frequently compounds transaction costs; a continuous weighting scheme limits unnecessary turnover.
- Calibrate stop and hedge placement to regime persistence, not a fixed dollar or percentage rule.
- Test any regime model on a holdout sample, and run regression diagnostics before trusting it with live capital.
How to Validate a Regime Signal Before You Trade It
Academic work on two-state Hidden Markov Models shows that states can be identifiable and that expected durations can be estimated with reasonable confidence, but identifiability does not guarantee profitability. The EPFL regime-based strategy paper found cases where a statistically valid regime signal failed to beat a static blend, simply because the underlying sleeve returns lacked meaningful state dependence.
- Regress the return differential between your candidate sleeves on the prior day's regime probability and require a consistent, statistically significant sign.
- Estimate expected state durations so your sizing rules match realistic holding periods rather than guesswork.
- Simulate turnover costs under your switching rule before assuming the regime signal adds net value after fees.
How a Decision-Intelligence Platform Helps You Apply Regime Signals
Even a well-validated regime model fails if execution breaks down under stress, which is usually a behavioral problem, not a modeling one. We built EI ALGOS around scoring the decision itself: a six-factor analytical engine evaluates entry discipline, sizing discipline, and emotional consistency, while our LIANA assistant flags patterns like oversizing after a shock or abandoning a cooldown rule. Pairing a regime filter with process scoring helps you catch the moment your own behavior, not your model, becomes the risk.

Where Regime Trading Fits in a Retail Quant's Toolbox
Regime frameworks earn their keep mostly in risk control and sizing, not in generating fresh alpha. We'd treat any regime signal with skepticism until you've confirmed state dependence with a simple regression and priced in realistic turnover costs. Overfitting a four-state model to five years of data is easy; surviving the next regime shift is the actual test. Run the diagnostics first, trade second.
— Anantha
Try a Process-First Way to Trade Regimes
We built EI ALGOS for traders who already understand that detecting a regime is only half the problem, sticking to the right tactic under pressure is the other half. Our six-factor scoring engine and LIANA assistant give you personalized feedback on entry timing, sizing consistency, and post-shock behavior, the exact moments where regime-aware plans tend to break down.
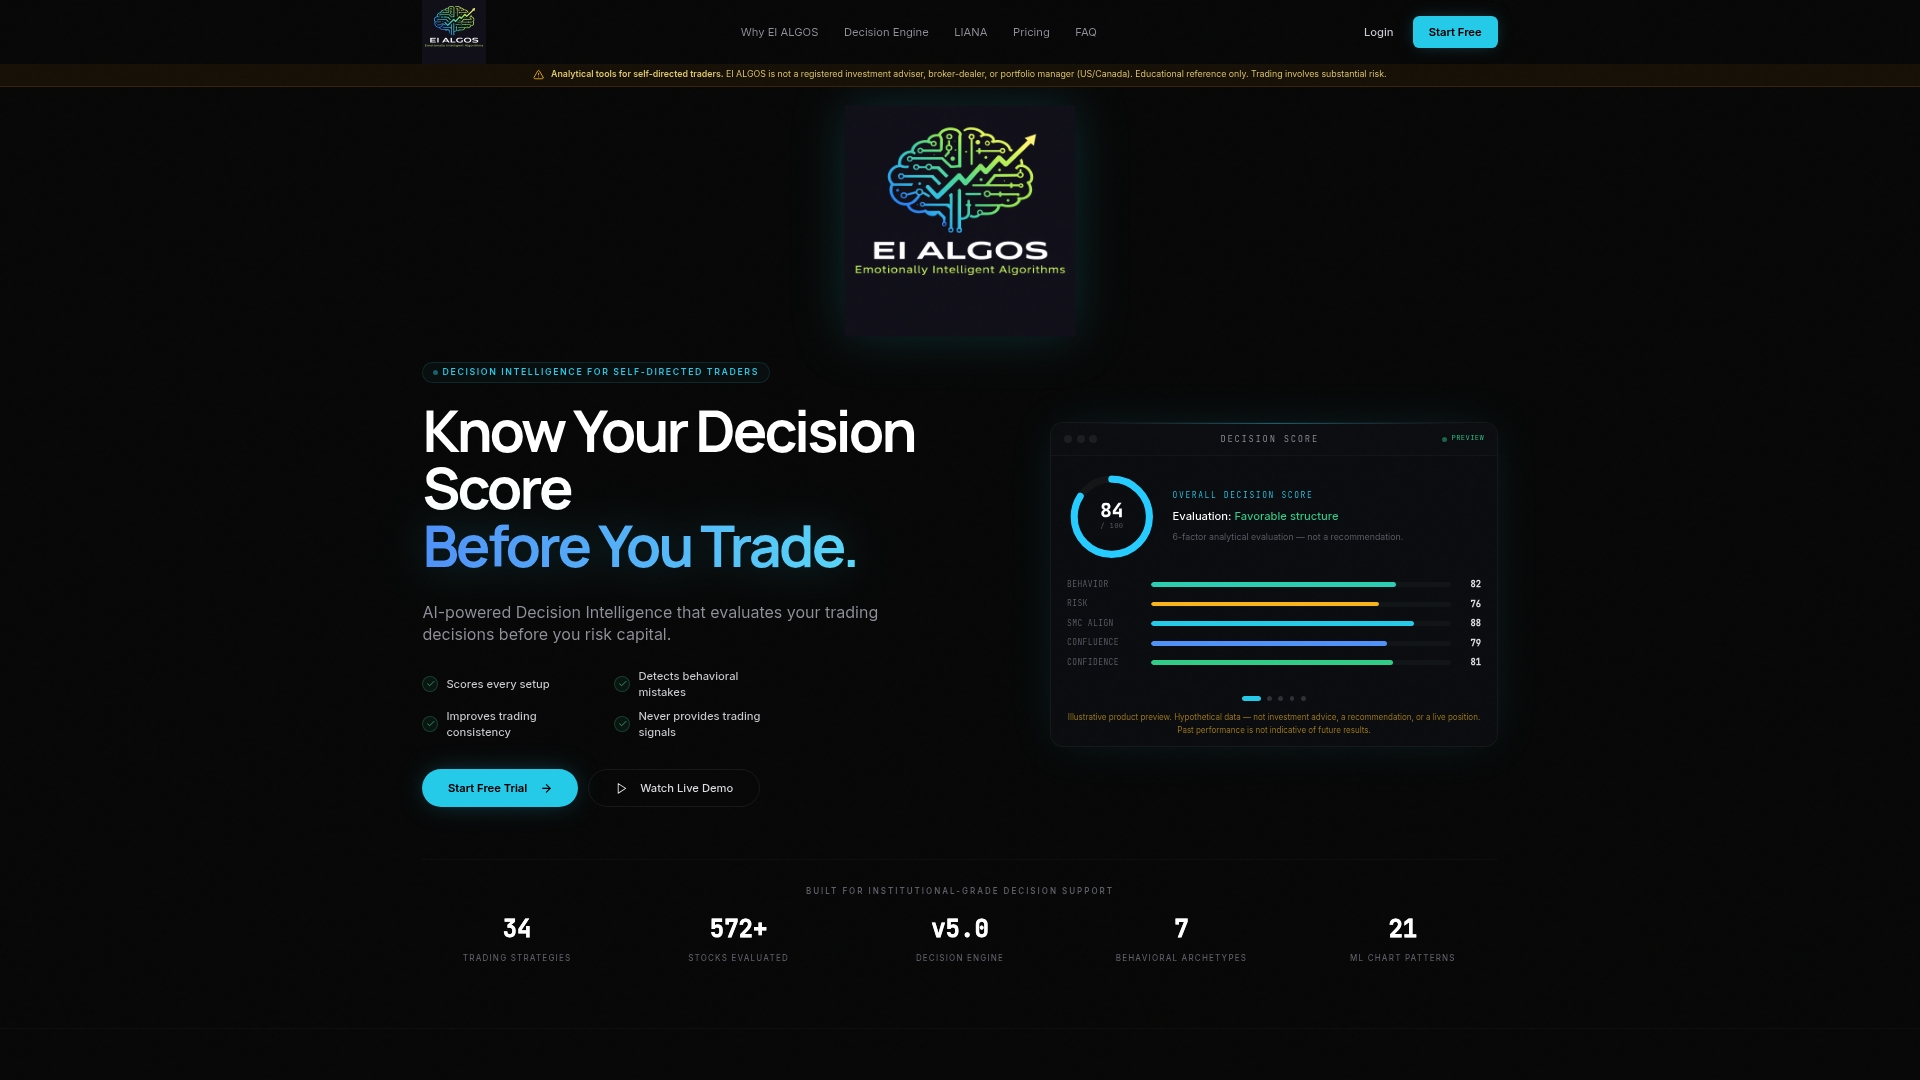
Our Free, Starter, Pro, and Elite plans give you a path to start scoring your own decisions today, with paid tiers unlocking deeper behavioral analytics as your process matures.
FAQ
What is the 3-5-7 rule in trading?
It is a generic risk cap rather than a volatility-regime-specific rule, so pair it with regime-based sizing adjustments for better results.
What does Warren Buffett say about volatility?
Buffett has long argued that price volatility is not the same as risk, and that permanent loss of capital, not short-term price swings, is what investors should fear. His framing supports treating volatility as information to manage rather than a reason to panic.
Is volatility trading profitable?
Volatility trading can be profitable, but profitability depends heavily on whether your sleeve returns show genuine state dependence on the regime signal, something the EPFL regime research found is not guaranteed. Costs like negative roll yield on VIX futures products can also erode returns even when the underlying thesis is sound.
Is 20% volatility high?
Whether it counts as "high" depends on the asset's own historical percentile rank rather than a fixed universal threshold.