
Representativeness bias is the habit of judging a trade by how closely it resembles a familiar story, pattern or winner, instead of by the actual odds. A chart "looks like" the last big breakout, a stock "looks like" a great company, and you act on the resemblance. The fix is to price in base rates, check your sample size and score each setup against the same criteria every time.
This guide explains where the bias comes from, shows documented examples from U.S. markets, and gives you a practical routine to catch it before you click buy or sell.
TL;DR
- Representativeness bias means judging probability by resemblance, not by statistical odds. Kahneman and Tversky described it in the early 1970s.
- It shows up in two main forms: base-rate neglect and sample-size neglect.
- Common trading versions: reading orderly patterns into random price moves, chasing past winners, and turning one data point into a trend.
- The standard fix is to start with the base rate, then adjust for what is truly different about this setup.
- A structured, repeatable review of every trade makes the bias visible in your own history. That is what we built EI ALGOS to do.
Table of Contents
- What representativeness bias is
- The two forms: base-rate and sample-size neglect
- Examples of representativeness bias in trading
- How it differs from other trading biases
- How to reduce representativeness bias
- Our perspective
- Put the review into practice with EI ALGOS
- FAQ
- Sources
What representativeness bias is
In their 1974 Science paper, Kahneman and Tversky described the representativeness heuristic as judging whether object or event A belongs to class B by how much A resembles B, rather than by actual statistical odds. Their earlier 1972 paper made the definition sharper. A person judges an uncertain event by the degree to which it is similar in essential properties to its parent population and reflects the salient features of the process that generated it.
That shortcut is fast and often right. The trouble starts when resemblance replaces probability. The same 1974 paper argues that similarity is not affected by several factors that should drive a probability judgment, including the prior probability, or base rate, of outcomes. If you judge by resemblance, the base rate gets ignored.
For a trader, this is not an abstract lab finding. Every time you think "this looks like the setup that worked," you are making a representativeness judgment. The question you skip is: how often does a setup that looks like this actually work?

The two forms: base-rate and sample-size neglect
CFA Institute exam prep materials break the bias into two sub-forms:
- Base-rate neglect. An event's incidence rate in a larger population is ignored in favor of particular information about the case in front of you.
- Sample-size neglect. Investors mistakenly assume that small samples represent the population accurately.
Here is how each looks on a trading screen.
Base-rate neglect. You spot a bull flag on a small-cap stock with a strong story. It matches the textbook picture, so you size up. What you never asked is how often flags on small caps in that kind of market resolve upward. The picture was vivid. The base rate was invisible.
Sample-size neglect. You take four winning trades with a new entry method and conclude the method works. Four trades is a small sample. Any entry style can win four in a row by luck, so the streak says little about the method.
Examples of representativeness bias in trading
The search for "examples" usually wants concrete cases. These are documented ones, plus the everyday versions you will recognize from your own screen.
The 1987 crash that looked like 1929
The Institute of Behavioral Finance uses the October 1987 crash as a textbook case. Many investors assumed a Great Depression would follow because the drop resembled 1929, even though there have been many crashes but only one Great Depression. The same discussion notes that the S&P 500 traded at a little over 13 times earnings, against a long-term average of 15 to 16. The surface similarity was loud. The valuation data pointed somewhere else. The same source also describes the 1990 Gulf Crisis market fall as a reaction to surface similarities with earlier oil crises.
Chasing last year's winners
Barber, Odean and Zheng studied more than 30,000 U.S. households at a large discount broker over the six years ending in 1996. Over half of fund purchases, and nearly 40 percent of fund sales, involved funds in the top quintile of past annual returns. The authors tie the buying of past winners to the representativeness heuristic: a fund that has performed well is seen as representative of a good fund, so it is expected to keep winning.
The same logic shows up in stock picking. "Great company, so great stock" treats quality as if it guaranteed returns. John Nofsinger describes this as investors extrapolating the past and assuming that good companies are good investments. A well-run business can still be an expensive stock.

Seeing order in random price moves
Harvey Pines, writing for the American Association of Individual Investors, explains how the heuristic works in technical analysis. Short-run price changes often seem to follow systematic patterns, so traders conclude that the market process behind them is orderly, when the apparently regular sequence may in fact be randomly generated.
This does not make chart reading worthless. It means a pattern that looks convincing is not yet evidence. You still need to know how often that pattern has paid off across many instances, in your own trades or in a large enough data set.
Judging risk by the shape of the chart
A 2009 study by Priya Raghubir (New York University) and Sanjiv Das (Santa Clara University) found that investors rated stocks with shorter up-and-down runs as less risky than stocks with longer runs. The effect grew with education and with the frequency, length and diversity of trading experience. Experience did not remove the bias in that study. It made the visual shortcut stronger.
One bad quarter becomes a trend
A behavioral biases guide from the asset manager CQS describes the bias as turning a single point, data item or event into a wider trend. One consequence it names is selling too soon after a one-off negative blip at a company and missing later gains.
The version on your own screen
Three habits to watch for in daily trading:
- The lookalike entry. "This is exactly like that NVDA move last spring." Two charts match on shape, but the volume, the market backdrop and the catalyst do not.
- The hot-hand strategy. A week of green after switching approaches feels like proof. It is a small sample.
- The story fit. A stock with a compelling narrative gets treated as a winner before any risk or entry analysis is done.
How it differs from other trading biases
Several biases look similar from the outside. The difference is in the mental move behind each.
| Bias | The mental move | Typical trading error |
|---|---|---|
| Representativeness | "This looks like a known type, so it will behave like it." | Buying a lookalike setup without checking how often it works |
| Availability | "I can recall this easily, so it must be common." | Overweighting the last dramatic event |
| Gambler's fallacy | "A streak has gone on too long, so it must reverse." | Fading a trend because it feels overdue |
| Loss aversion | "Losses hurt more than equal gains feel good." | Cutting winners early and holding losers |
| Familiarity | "I know this firm, so it is safer." | Low diversification |
Nofsinger separates the first and last rows clearly: representativeness leads investors to extrapolate the past, while familiarity leads them to believe that firms they know are better investments, which drives low diversification and higher risk.
Representativeness also overlaps with the gambler's fallacy, since both involve misjudging randomness. If you want the streak side of that story, read our piece on why streaks do not predict reversals. For the recall-driven cousin, see the availability heuristic in trading. For the bias that explains why winners get cut, see loss aversion in trading.
There is also an opposite error. Barberis, Shleifer and Vishny's well-known model of investor sentiment treats representativeness and conservatism as opposite effects: one puts too much weight on a sample, the other too little. After a run of good earnings reports, representativeness takes over and the investor reacts too much. Knowing both errors exist keeps you from overcorrecting into ignoring new information.
The CQS guide also draws a line between cognitive and emotional biases. Cognitive biases come from informational or computational limits and may be overcome with information, advice, experience and education. Representativeness sits on the cognitive side, which is good news: it responds to better process.
How to reduce representativeness bias
You cannot switch the heuristic off. You can build steps that force the base rate and the sample size into the decision.
1. Start with the outside view
CFA Level 2 materials describe a stronger forecast as one that uses both the outside view (the base rate) and the inside view (details of the specific case). The recommended order is to start with the base rate, then adjust for what distinguishes the target from the average.
For a trade, ask: across all setups of this type that I have taken, how many worked? Then ask what is actually different today, and whether that difference has evidence behind it.
2. Count your sample before you trust it
Before you call a method "working," write down how many trades you have taken with it. A handful is an anecdote. Set a minimum count in advance, and review only when you reach it.
3. Write the setup criteria before the trade
A lookalike is a feeling. A checklist is a test. List the conditions that define a valid setup: trend context, level, volume, risk-to-reward, position size. If the trade only passes because it looks familiar, it fails the list.
4. Separate the story from the stats
When a stock has a compelling narrative, note the narrative on one line and the numbers on another: valuation, volatility, stop distance. Trade the second line.
5. Take a long-term view of single data points
The CQS guide recommends a long-term view as the mitigation for treating one event as a trend. In practice, ask whether one earnings miss or one red day changes your thesis, or only your mood.
6. Review your trades for the pattern
Bias is easiest to see in aggregate. Tag each trade by setup type and your reason for entry. After a month, look for entries where your reason was "it looks like..." and compare their results with the rest. Our walkthrough on how to run a 30 day behavioral trading analysis shows one way to structure that review, and our page on trader behavior analysis explains how profile, patterns and drift are tracked over time.
Our perspective
Most trading tools answer one question: what will the market do? Representativeness bias lives in a different question: what will I do when a setup looks familiar?
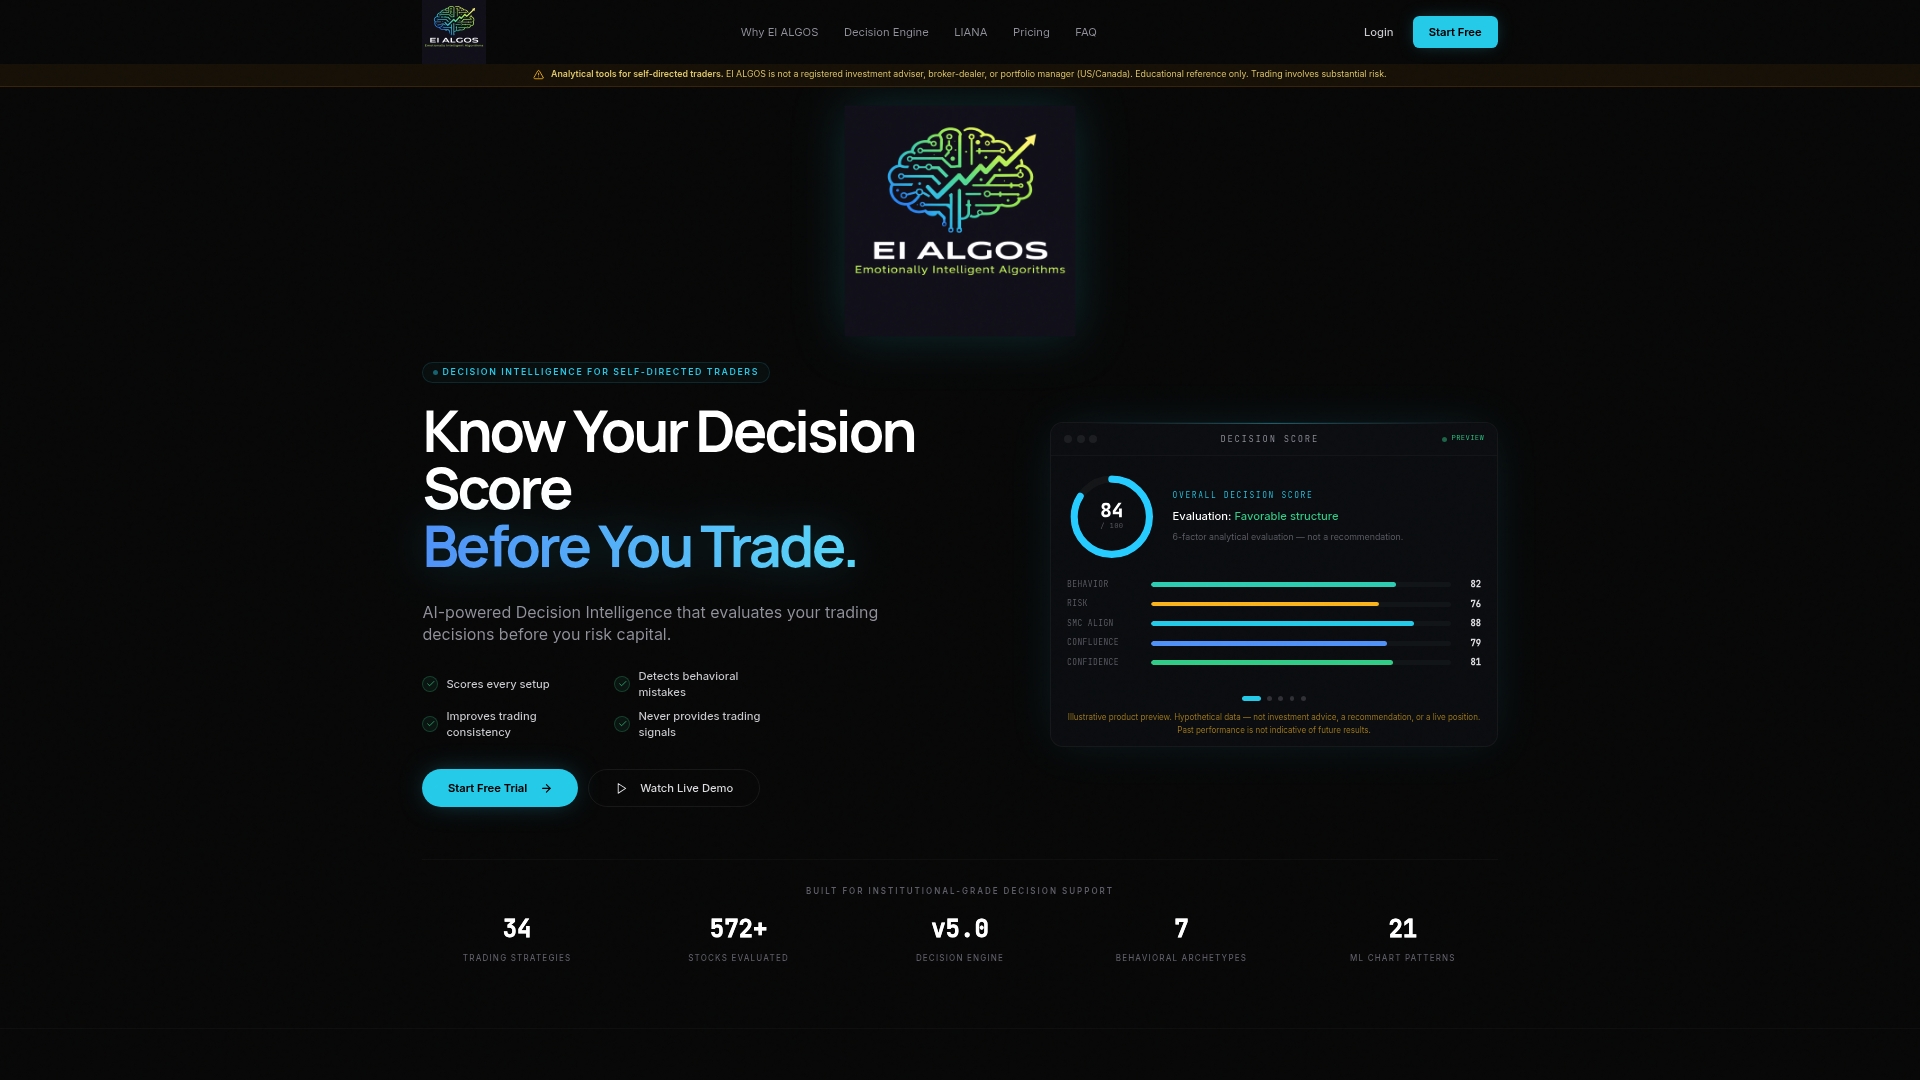
That is why we built EI ALGOS around the decision, not the forecast. We do not issue trade signals or market predictions. Our platform scores each setup on a six-factor analytical engine that looks at the behavioral and psychological side of the decision, so a chart that merely looks right does not get a free pass.
Representativeness bias is hard to catch in the moment because it feels like experience. It shows up clearly in your trade history, though. Our LIANA assistant gives personalized feedback on your own patterns, and the platform is designed to help you detect behavioral errors and refine your process over time.
Our view is simple: consistency comes from a repeatable process that you can see and measure, not from a better hunch.
Anantha
Put the review into practice with EI ALGOS
If you want to see where resemblance is driving your entries, EI ALGOS gives you a structured way to score setups, review trades and spot recurring behavioral errors. You can start on the Free plan at $0 per month. Paid plans are Starter at $49 per month, Pro at $129 per month and Elite at $229 per month. See the plans and what each includes.
To see how the pieces fit, read how EI ALGOS works, look at the AI-coached trading journal, or meet LIANA, the AI trading coach. For the wider context, our page on behavioral trading covers how behavior drives retail results, and our emotional trading guide covers the emotional side.
FAQ
What is an example of representativeness bias in trading?
The 1987 crash is the classic case. Many investors expected a second Great Depression because the drop resembled 1929, although valuations at the time were near normal levels. A day-to-day example is buying a chart because it looks like a past winner without checking how often that pattern pays off.
Is representativeness bias the same as the gambler's fallacy?
No, but they are related. Both involve misjudging randomness. Representativeness judges by resemblance, such as expecting a short sample to look like the whole population. The gambler's fallacy expects a streak to reverse. We cover the second in our article on why streaks do not predict reversals.
Does more experience remove the bias?
Not by itself. In the 2009 Raghubir and Das study, the effect of chart run-length on perceived risk increased with education and trading experience. What helps is process: base rates, minimum sample sizes and written setup criteria that you apply every time.
How do I know if I am trading on representativeness?
Look at your entry notes. If your reasons often read "looks like," "reminds me of" or "same as last time," resemblance is doing the work. Tag those trades and compare their results with trades that passed a written checklist. A structured review of your history makes the pattern visible.
Can software help with this bias?
Software can help by making your process explicit and measurable. EI ALGOS scores each setup on a six-factor engine and gives feedback on your own behavior through LIANA. It does not give trade signals or tell you what to buy or sell. The decision stays with you.
Sources
- Judgment under Uncertainty: Heuristics and Biases (Tversky and Kahneman, 1974)
- Subjective Probability: A Judgment of Representativeness (Kahneman and Tversky, 1972)
- Behavioral Bias in Financial Decisions, CFA Level 1 (AnalystPrep)
- Behavioral Finance and Analyst Forecasts, CFA Level 2 (AnalystPrep)
- Institute of Behavioral Finance, Research, chapter 10
- The Behavior of Mutual Fund Investors (Barber, Odean and Zheng)
- A New Psychological Perspective on Investor Decision Making (AAII)
- Stock graphs can mislead (EurekAlert, Raghubir and Das)
- Representativeness and Familiarity (John Nofsinger, Taylor & Francis)
- CQS Behavioral Biases: Know Them to Tame Them
- A Model of Investor Sentiment (Barberis, Shleifer and Vishny)