
Trading bias detection means spotting the behavioral and psychological errors that distort your trade decisions, not guessing which way price will move. Start by checking a few signals: how often you trade, how long you take to decide, and whether you cut winners early while holding losers. Begin a 30-day behavior log today and add one pre-trade rule, such as a 60-second forced delay before every entry.
TL;DR:
- Track trade frequency, decision time, position size, and realized gains versus losses; abrupt changes from your baseline can flag overconfidence, impulsivity, or the disposition effect.
- Log your behavior for 30 days and compare daily markers with your principles; high trade counts may suit scalpers but conflict with swing trading plans.
- One informational intervention reduced the disposition effect for up to two weeks but showed no significant impact at three months, so schedule recurring feedback.
- Judge progress by rule adherence, trade count, and position size before profit and loss, since market returns can conceal or imitate behavioral improvement.
- Experience does not eliminate bias: 34% of 237 financial professionals showed the disposition effect, so monitor behavior rather than relying on expertise.
Table of Contents
- What does trading bias detection actually mean for you?
- Which behavioral biases should you look for?
- What can you measure right away?
- How can you surface bias in a single week?
- How do you build a repeatable detection process?
- Which interventions work, and how long do they last?
- What does sustained progress look like?
- Why process beats chasing signals
- How a Decision Intelligence platform automates this process
- FAQ
- Sources
What does trading bias detection actually mean for you?
Trading bias detection is the practice of finding behavioral and psychological errors in your decisions. This article covers those errors only, not bullish or bearish price outlooks.
The stakes are real. A Library of Congress report notes that active trading is strongly correlated with overconfidence and underperformance among online traders. A lab-in-the-field study of 237 financial professionals found that 34% showed the disposition effect, so experience alone does not protect you.
Detection turns vague self-criticism ("I'm too impulsive") into numbers you can track. Once a habit has a metric, you can test whether it is getting better or worse.
Which behavioral biases should you look for?
The SEC's behavioral patterns summary gives working definitions for the patterns below.
Disposition effect. You sell winners too soon and hold losers too long. Foundational research found that individual investors are more likely to sell winners than losers, and a 2024 experiment tested ways to debias it.
Overconfidence and active trading. Turnover climbs after a win streak, and the same research links excessive trading to lower net returns after costs.
Noise trading. You react to social chatter instead of your plan.
Momentum chasing. You buy what just spiked.
Familiarity bias. You keep trading the same few names because they feel safe.
Naive diversification. You spread capital evenly across positions without regard to risk.
What can you measure right away?
Several metrics cover most of the ground:
- Trade frequency: trades per day or week against your own baseline. Spikes after wins often signal overconfidence.
- Decision time: minutes from first looking at a setup to execution. Very short times suggest impulsivity, and very long ones suggest hesitation. A six-week field study of MindStock found decision time, trade size, and trade frequency useful for flagging impulsivity or overconfidence.
- Trade size versus baseline: sudden jumps point to overconfidence, and sudden shrinkage points to loss-driven risk avoidance.
- PGR and PLR: the proportion of gains realized versus the proportion of losses realized. A PGR well above your PLR indicates the disposition effect. Our guide to tracking PGR and PLR walks through the math.
- News-checking: how often you open headlines or social feeds mid-trade.
Pull these from your broker's export or a journal. Any metric that moves sharply from your own average deserves a closer look.
Pro Tip: Record decision time with a simple timestamp when you first open the chart. Memory is unreliable here.
How can you surface bias in a single week?
Three short exercises work without special software:
- The trade snapshot. For your last five trades, write down the reason for entry, the planned exit, and the actual exit. Gaps between plan and action are your first clues.
- The principles test. Write three trade principles, then compare your actual trades against them for one week. MindStock's field study found that pairing principles with behavioral metrics produced meaningful reflection.
- The 30-day baseline. Log the same daily markers for 30 days. A consistent logging period can help smooth out an unusual market stretch while still being manageable. Our 30-day behavioral analysis template shows one way to run it.
How do you build a repeatable detection process?
Turn the metrics into a routine with three layers.
Daily markers:
- Trade count
- Median decision time
- Number of exits made out of emotion
- Deviation from planned position size
Weekly checkpoint: treat a sharp rise in trade count over your personal baseline as a red flag. This is a starting heuristic, not a research finding, so tune it to your style.
30-day review: chart the daily markers, find the bias that shows up in most weeks, and pick one measurable habit goal, such as cutting weekly trades back to baseline.

Always read metrics next to your principles. A high trade count is fine for a scalper whose plan calls for it, and a problem for a swing trader whose plan does not.
Pro Tip: Review on the same day each week so the habit sticks and comparisons stay clean.
Which interventions work, and how long do they last?
Evidence says feedback helps but fades. In a study of 132 UK participants, an informational intervention reduced the disposition effect for up to two weeks, with no significant impact at three months. Context also matters: a within-subject experiment with 193 professional traders found an informational intervention helped returns for some securities and could hurt in others.
Tactics that fit this evidence:
- A pre-trade checklist covering plan, size, and exit
- A forced delay of 60 seconds before entry
- A templated post-trade reflection
- Scheduled weekly reminders to review your metrics
- Periodic refreshers, since one-off fixes fade
Measure the effect of each change. Without numbers, a short-lived improvement can look like a permanent one.
What does sustained progress look like?
Expect behavior to improve before profit and loss does. Returns depend on markets, so a clean month can still lose money, and a lucky month can hide bad habits.
- Compare against a rolling baseline and use percent change, not one before-and-after snapshot.
- Judge each cycle by process metrics first: trade count, size consistency, rule adherence.
- Escalate to a platform or coach when the same bias persists across repeated monitoring cycles, or when you cannot interpret your metrics alone.
- Keep every log in one place so month-to-month comparison stays possible.
Why process beats chasing signals
I'd rather see a trader fix one measurable habit than buy another signal service. Signals tell you what to do next, while detection tells you why you keep undermining your own plan. The research above points the same way: feedback paired with your own principles prompts real reflection, and it needs repeating. Start small. One log, one rule, one review, then iterate.
— Anantha
How a Decision Intelligence platform automates this process
Manual logging works, but it is tedious, and tedious habits fade. At EI ALGOS we built our Behavioral Decision Intelligence platform to carry that load.
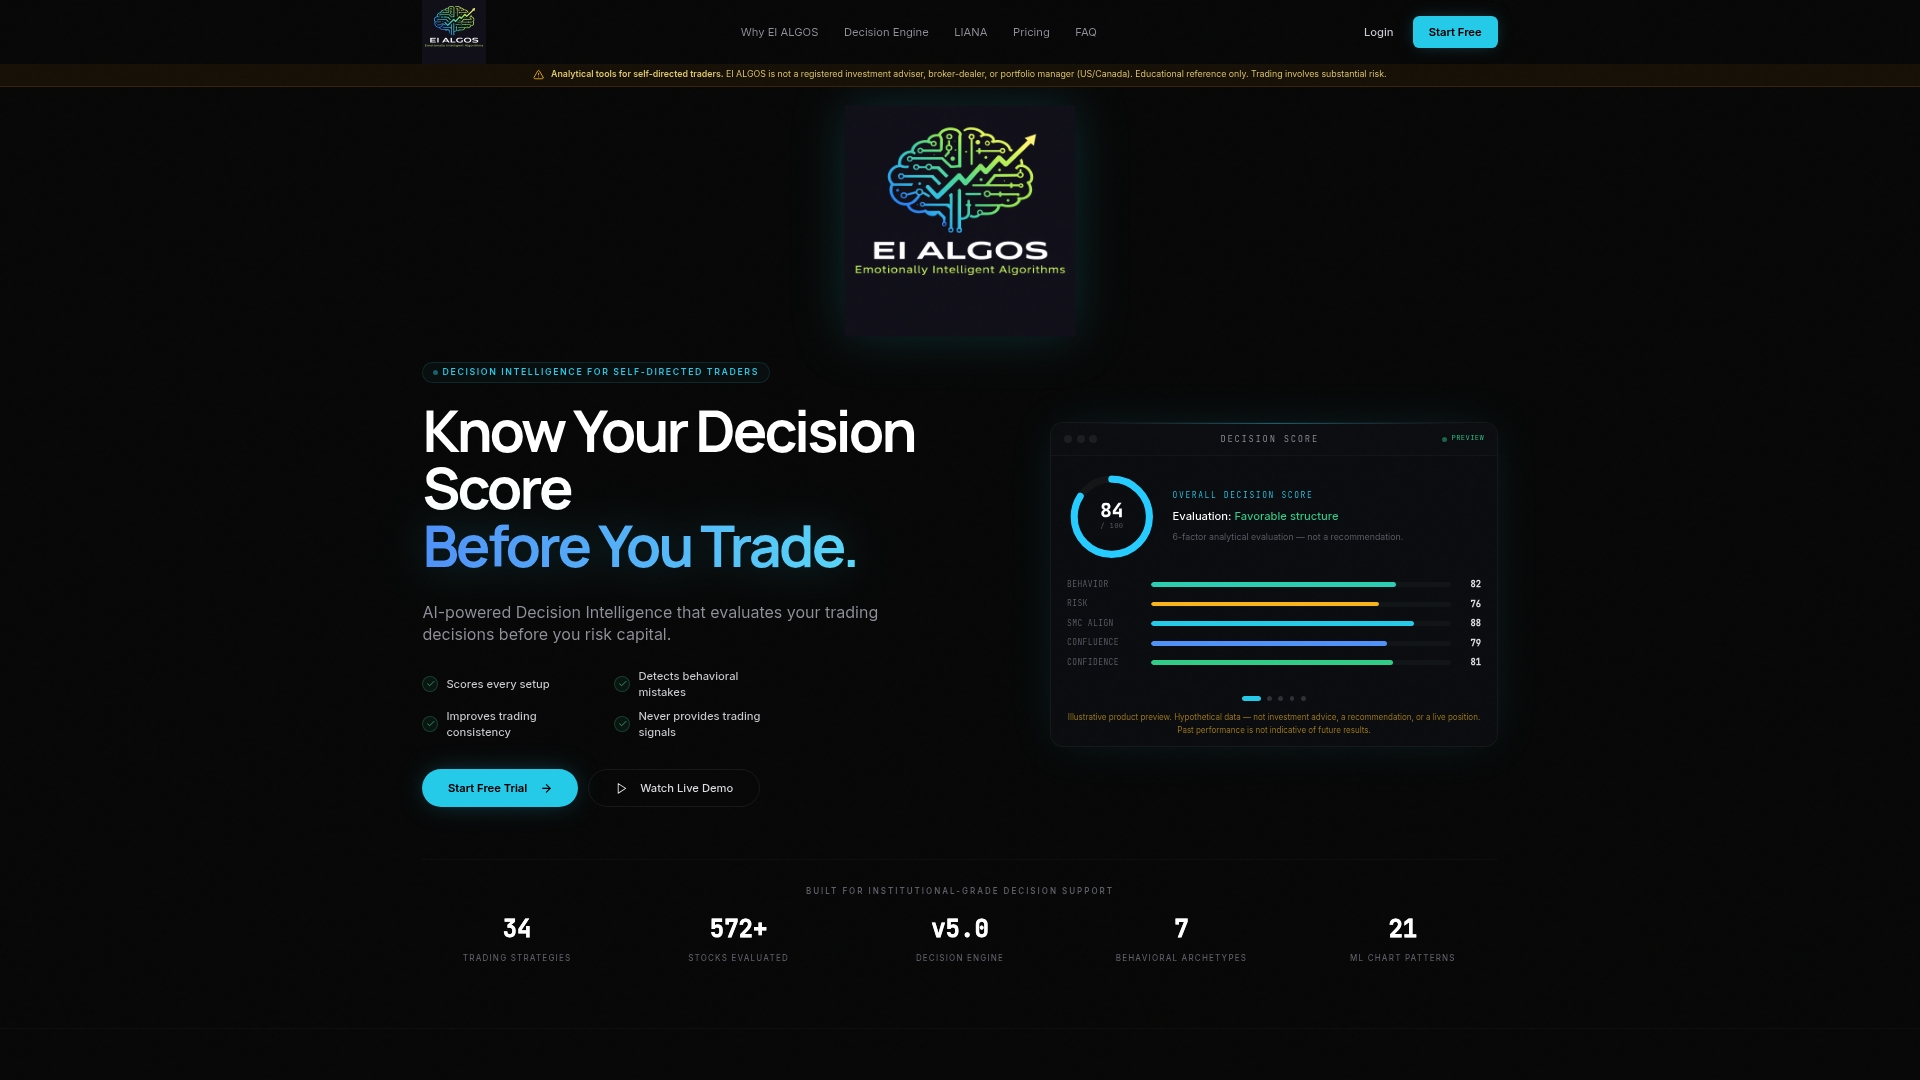
- We score each setup with an analytical engine focused on your decision process, with no trade signals.
- Our LIANA assistant gives personalized feedback on your own trading patterns.
- Our tools provide live trade management and help identify behavioral errors.
That frees you to focus on interpreting results instead of building spreadsheets. We offer a Free plan at $0 per month. See our plans and start today.
FAQ
What is trading bias detection?
It is the process of identifying behavioral and psychological errors in your trading decisions, such as overtrading or the disposition effect. It focuses on your habits and process, not on predicting price direction.
How long does it take to detect a trading bias?
A 30-day log gives most traders enough data to see a recurring pattern. Regular checkpoints can flag problems sooner, such as a sharp rise in trade count.
Do debiasing interventions last?
Often not on their own. One experiment found effects lasting about two weeks with no significant impact at three months, so periodic feedback is more sustainable.
Can experienced traders have these biases?
Yes. A study of 237 financial professionals found that 34% showed the disposition effect, so experience does not make you immune.
Sources
- Irrational Beliefs May Drive the Disposition Effect: Evidence from Financial Professionals | Journal of Financial and Quantitative Analysis | Cambridge Core
- Library of Congress Report: Behavioral Patterns of U.S. Investors
- MindStock: Investigating How Principle-Anchored Feedback Supports Self-Reflection in Mobile Investment | Proceedings of the 2026 Designing Interactive Systems Conference
- Huang, Lingxi & Guenther, Benno (2024) Information and context matter: debiasing the disposition effect with lasting impact. Frontiers in Behavioral Economics, 3, https://doi.org/10.3389/frbhe.2024.1345875