
A trade tagging system is a rule-driven, timestamped label set you attach to trades and trading days so you can measure what actually worked. Start by choosing one primary tag category, such as setup type, and tag your next several trades immediately at the moment you decide to enter. This single habit turns a flat trade log into a searchable performance record and surfaces behavioral patterns you cannot see from profit and loss alone.
TL;DR:
- Using specific, consistent tags such as setup type and market context helps isolate which patterns or conditions lead to successful trades.
- Tracking both trade-level and day-level tags prevents misattributing results to strategy choices when day-wide factors also influence outcomes.
- Limited primary tags—around ten—ensure your reports remain clear and actionable, avoiding confusion from overlapping or excessive labels.
- Tags should be assigned at entry for setup and context, and only at exit for outcomes, to minimize hindsight bias and maintain data integrity.
- Implementing automated or semi-automated tags with tools like AI scoring can provide objective insights into behavioral patterns and help identify hidden leaks.
Table of Contents
- What to tag: trade, day, session, and behavior categories
- How to name and organize tags so they stay useful
- When to record tags without letting hindsight creep in
- Choosing a system: spreadsheets, journal apps, or automation
- Turning tags into metrics that reveal your edge
- Copy these tag templates and start today
- Why systematic tagging changes how you see your own trading
- Let a Decision Intelligence platform carry the analysis for you
- FAQ
- Sources
What to tag: trade, day, session, and behavior categories
A useful taxonomy covers more than entry and exit prices. Each category answers a different question about your trading, and mixing them without structure makes your reports unreliable.
- Setup tags (breakout, pullback, range fade) measure which patterns actually produce an edge.
- Strategy tags (trend-following, mean-reversion) group setups by the broader approach they belong to.
- Mistake tags (sized too big, skipped stop-loss) isolate execution errors from strategy quality.
- Market context tags (high volatility, news-driven, low liquidity) show whether conditions, not skill, drove results.
- Day-level tags (well-rested, distracted, late start) capture session-wide factors that affect every trade placed that day.
Trade-level tags answer "what worked on this position," while day-level tags answer "what conditions shaped the whole session." Tracking both matters because a string of losses sometimes traces back to the setup and sometimes to the day. A reliable taxonomy keeps these categories separate so a report on setups is not quietly polluted by a bad Tuesday.
How to name and organize tags so they stay useful
Tags only produce clean metrics when they follow consistent rules. A tag named "bad trade" tells you nothing searchable; a tag named "stop moved after entry" does.
- Use short, specific, single-purpose names: one tag, one meaning, no overlap with a near-synonym.
- Group tags under parent categories (Setup, Mistake, Context) so reports can roll up or drill down.
- Reserve a small set of primary tags for every trade and treat the rest as optional secondary tags.
- Retire or merge a tag once you notice it duplicates another, rather than letting both survive.
- Version your taxonomy: note the date you add or retire a tag so historical reports stay interpretable.
Pro Tip: Keep your primary tag list under about ten entries; a taxonomy with many overlapping tags produces reports nobody reads.
A practical implementation, like the tag system described in the journedge trade-journal project, stores tags in a single global table so every new tag is available across the whole journal immediately, which avoids the duplicate-tag problem that kills most homemade systems within a month.

When to record tags without letting hindsight creep in
Timing determines whether a tag reflects what you actually saw or what you later wish you had seen. Research on hindsight bias explains why a label applied after you know the outcome tends to rewrite the decision in your memory, which is why the tagging moment matters as much as the tag itself.
- Tag at entry with pre-trade labels: setup type, context, and your stated plan for the trade.
- Tag at exit with outcome-adjacent labels only: target hit, stopped out, time exit.
- Save judgment tags like "mistake" for the review session, after you compare the plan tag to what actually happened.
- When bulk-tagging older trades, verify a random sample after the pass and rerun a tag-performance view before trusting the results.
- Run a short daily check on execution tags and a longer weekly review on tag-group performance to catch drift early.
Recording close to the decision, and favoring tags you can derive mechanically rather than ones you assign by feeling, keeps your data reproducible instead of self-serving.
Choosing a system: spreadsheets, journal apps, or automation
A spreadsheet works for traders who want full control and do not mind manual entry. Build columns for date, instrument, setup tag, mistake tag, context tag, and outcome, then use a pivot table to summarize by tag.
- A manual journal needs fast entry fields: a dropdown for primary tags beats free text every time.
- A trade-journal app should offer a global tag list, tag groups, and quick-edit access so tagging takes seconds, not minutes.
- Mechanical tags flag conditions automatically: position size over your average, entry within 10 minutes of a prior loss, or trade count above your daily limit. These rules remove guesswork and hindsight from the equation entirely.
- A migration checklist for an existing journal: export your raw trade history, seed a global tag table from whatever labels you already use informally, spot-check a small sample for quality, then backfill the rest in batches.
Whichever format you pick, the taxonomy rules from the previous section still apply: short names, grouped categories, and one meaning per tag.
Turning tags into metrics that reveal your edge
Tags only pay off once you run numbers against them. The core metrics to pull per tag are expectancy, win rate, average return, and trade frequency, always alongside sample size so a hot streak on four trades does not masquerade as an edge.
- Compare tag-to-tag performance to see which setups actually carry positive expectancy.
- Track a tag-group over time to catch an edge decaying as market conditions shift.
- Cross-reference day-tags against trade outcomes to spot whether fatigue or distraction tags correlate with losses.
- Build a pivot summary or simple heatmap of tag versus outcome for a fast visual read.
A tag with fewer than 20 to 30 occurrences rarely supports a confident conclusion, so standard analytics guidance for small samples applies here as much as anywhere: pair every tag metric with a frequency count before you change your process based on it. Mechanical tags like "entered within 10 minutes of a loss" are especially useful in this analysis because they are reproducible: anyone looking at your raw data would assign the same label, which makes the resulting metric trustworthy instead of a story you told yourself after the fact.
Copy these tag templates and start today
You do not need to design a taxonomy from scratch. Three small templates cover most independent traders' needs, and each one maps directly to the categories above.
- Strategy template: setup (breakout, pullback, range), strategy (trend, mean-reversion), timeframe (intraday, swing).
- Behavior template: plan-followed, plan-deviated, sized-correctly, oversized, stopped-as-planned, stop-moved.
- Session template: well-rested, distracted, news-day, low-liquidity, first-trade-of-day, overtraded.
Adapt the wording to match your own setups and known weak points, but keep each tag single-purpose. Start small: tag your next 25 trades using just the strategy and behavior templates, then run a basic expectancy-by-tag report. That first report usually surfaces at least one obvious leak, often a mistake tag correlating with a disproportionate share of your losses.
Why systematic tagging changes how you see your own trading
Tagging forced me to separate what I planned from what I actually did, and that gap turned out to be where most of my losses lived. A platform builds on this same idea, scoring the behavioral side of each setup through a six-factor engine and surfacing patterns through an AI assistant rather than asking you to spot them by eye. Start with one tag group, stay consistent, and let the data accumulate before you judge it.
— Anantha
Let a Decision Intelligence platform carry the analysis for you
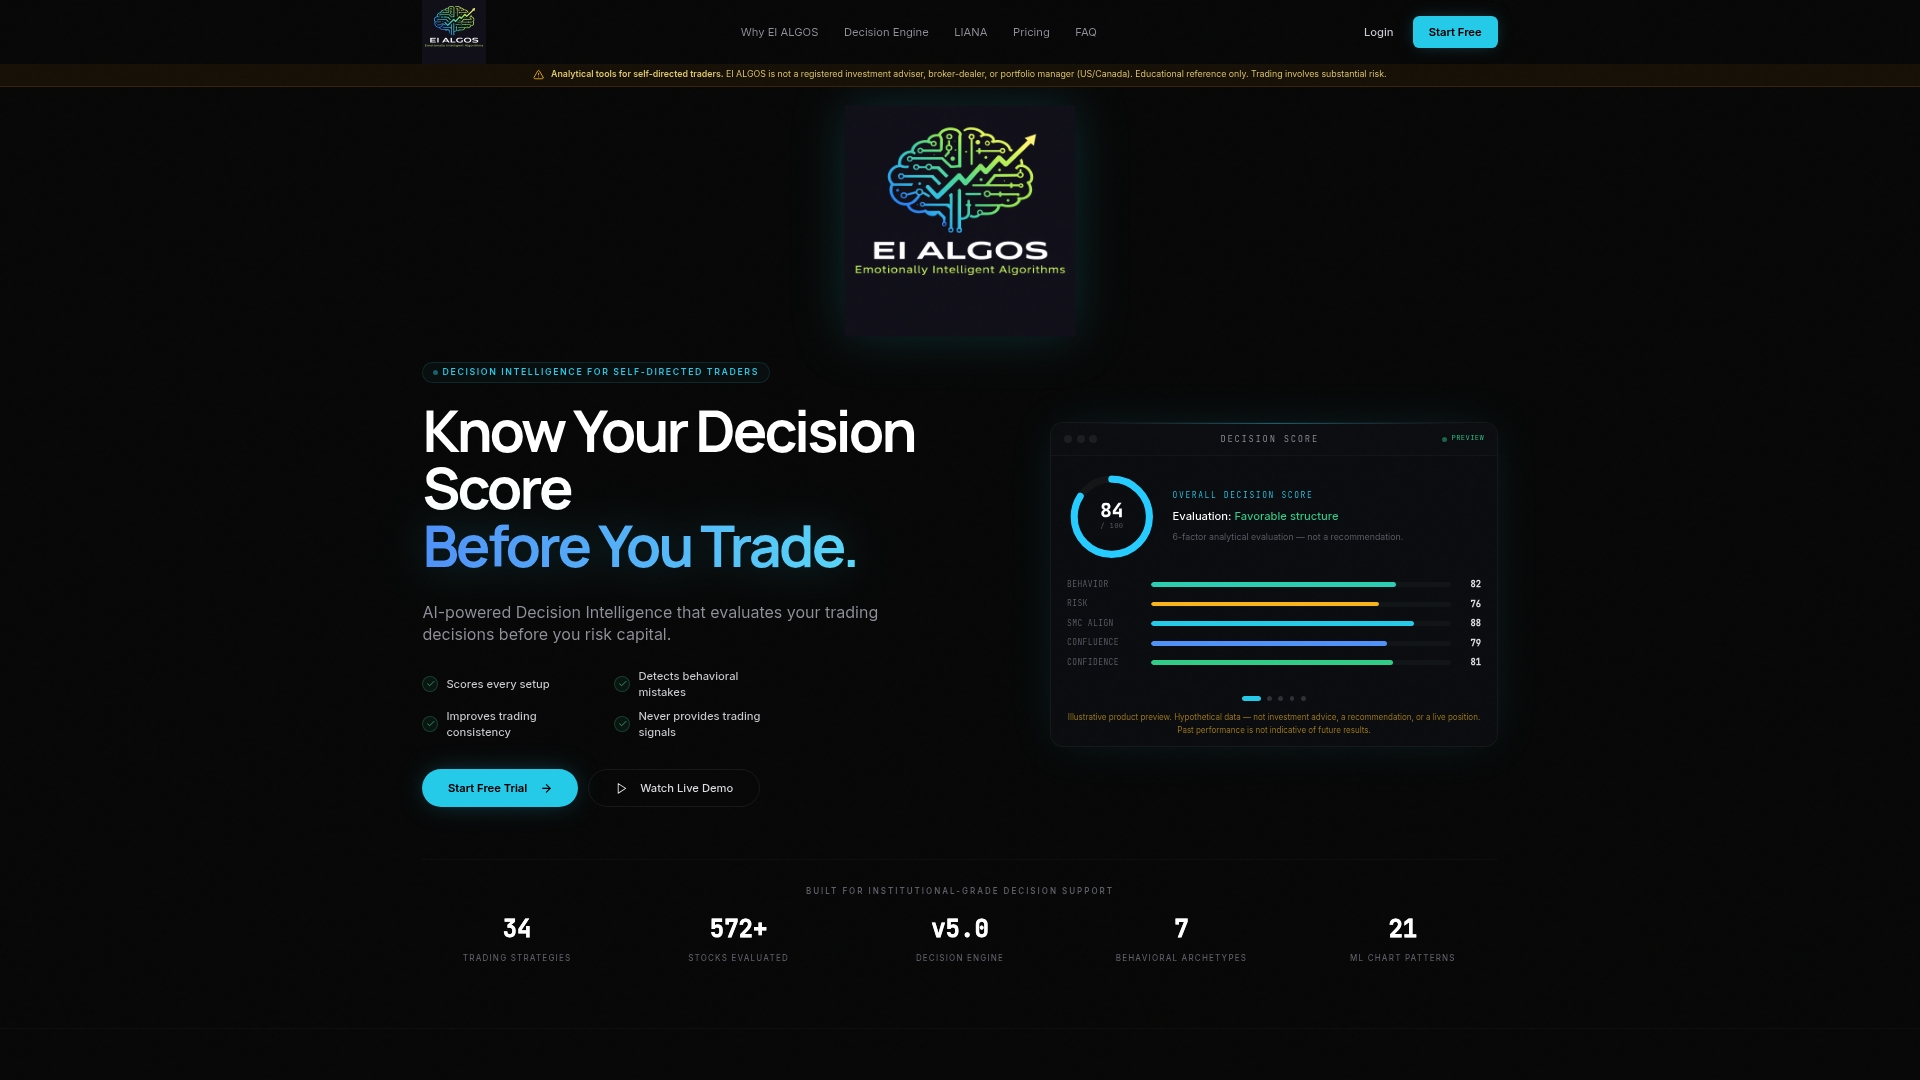
Manual tagging works, but reading your own tag reports for behavioral patterns takes time and a clear eye on your own blind spots, which is exactly where most of us struggle. We built our platform around that gap: instead of generic signals, our six-factor analytical engine scores the psychological and behavioral side of each setup, and our AI assistant turns that scoring into personalized feedback on your actual patterns, not generic advice.
- Traders who already tag manually get a faster path from raw labels to a measurable behavior score.
- Traders just starting out get a structured first step without building a taxonomy from zero.
- Options traders and self-directed investors get live trade management and strategy pattern detection alongside the behavioral scoring.
If you want to validate a tag-filtered strategy variant with backtesting before committing size to it, a no-code platform like QuantGenie is worth a look for that specific step. For the behavioral side, our Free, Starter, Pro, and Elite plans let you start scoring your own decisions at no cost and upgrade as your needs grow.
FAQ
What is a tagging system?
A tagging system is a set of consistent, rule-driven labels you attach to trades or trading days so you can search, group, and measure performance by category later. In trading, it typically covers setup type, strategy, mistakes, and market context so each label answers a specific, repeatable question.
What is a trade tracker?
A trade tracker is a journal, spreadsheet, or app that records your trades along with details like entry, exit, size, and outcome. When paired with a tagging system, a trade tracker becomes searchable by category, which turns a simple log into a tool for finding patterns in your results.
What are the different types of trading systems?
Trading systems generally fall into categories like trend-following, mean-reversion, breakout, and range-trading approaches, each defined by the market condition it is built to exploit. A tagging system complements any of these by letting you measure which one is actually performing for you, rather than assuming it based on feel.
What is the process of tagging?
Tagging is the process of attaching a short, specific label to a trade or trading day at or near the moment of the decision, so the label reflects what you actually saw rather than what you later concluded. The best practice is to record tags at entry and exit, save judgment calls for a separate review step, and favor labels you can derive mechanically to reduce hindsight bias.