
Scaling in trading means entering a position in multiple tranches rather than all at once, adding size only as the market confirms your thesis. The single operational rule: add to a position only when the trade is proving itself, and never let any add push your total open dollar risk above your pre-set per-trade budget. That one rule separates disciplined scaling from hope-based averaging.
Three concepts anchor every sound scaling approach:
- Fixed-fraction position sizing: compute your full target size from a fixed percentage of account equity (commonly 1–2% per trade), then divide that size into tranches before you place the first order.
- Per-trade risk cap: your dollar risk on the entire position, including all planned adds, is locked in before the first tranche is filled. Subsequent adds require stop tightening, not a higher risk budget.
- Confirmation signal: each add is triggered by a pre-defined market event (a breakout close, a VWAP reclaim, an ATR-based price move) — not by a feeling that the trade "should" work.
Pro Tip: Write your full scale-in plan, including all tranche sizes and confirmation triggers, before you place the probe. A plan written mid-trade is not a plan; it is a rationalization.
Key Takeaways
Disciplined scaling in trading requires a written plan, a constant-risk rule, and confirmation-based triggers — not intuition or hope.
| Point | Details |
|---|---|
| Define dollar risk first | Set your total R before the probe; no add may push combined open risk above that number. |
| Use confirmation signals | Each tranche needs a specific, observable market event to trigger it — not a feeling. |
| Tighten stops with every add | Stop adjustment is mandatory after each tranche; skipping it silently multiplies your risk. |
| Never add to losers | Adding to a losing position is averaging down, not scaling in, and increases risk-of-ruin. |
| Test and automate | Backtest with realistic slippage and use decision-intelligence or bracket orders to enforce the plan live. |
Table of Contents
- What does scale in trading actually mean?
- Common scaling-in methods and how to size each tranche
- How to build a scale-in plan before you trade
- Risk controls: keeping dollar risk constant as the position grows
- Scaling out: partial exits that protect profits without capping upside
- How to backtest scaling strategies without fooling yourself
- Execution tools and order types for reliable scaling
- Trader psychology and the mistakes that make scaling fail
- How decision-intelligence tools help traders scale in consistently
- Worked numerical examples and templates
- The part most scaling guides get wrong
- Sources
What does scale in trading actually mean?
Scaling in is the practice of building a position incrementally: you enter a small initial "probe," then add tranches as the market moves in your favor and confirms your original thesis. The goal is a better weighted average entry price while keeping initial dollar exposure low.
Scaling out is the mirror image: you exit in partial lots, locking in gains on a portion of the position while leaving the rest to run. Both are professional techniques. The confusion comes when traders conflate them with two other practices that carry very different risk profiles.
Key distinctions:
- Scaling in vs. averaging down: Scaling in adds to a position that is working. Averaging down adds to a position that is losing, hoping for a reversal. Averaging down increases risk-of-ruin and is widely discouraged by professional traders.
- Scaling in vs. DCA (dollar-cost averaging): DCA is a passive, time-based strategy used in long-term investing, adding a fixed dollar amount on a fixed schedule regardless of price action. Scaling in is an active, signal-triggered technique tied to trade confirmation.
- Scaling in vs. pyramiding: Pyramiding is a specific form of scaling in where each successive tranche is smaller than the previous one, so the position grows while average cost stays favorable. Standard scaling in does not require shrinking tranches.
Simple example of average entry impact:
Suppose you plan to buy 300 shares of a stock. A single fill at $50.00 gives you an average entry of $50.00. A three-tranche scale-in at $50.00, $50.40, and $50.80 (100 shares each) gives a weighted average of $50.40. The average is higher, but each add was triggered by upward confirmation, meaning the position was never fully sized at the riskiest moment.
Common scaling-in methods and how to size each tranche
Professional scale-in trading follows a three-phase structure: a small probe (25–40% of target size), a confirmation add (30–40%), and a final add when multiple signals align. Each phase has its own stop logic, and the stop must tighten with each add, so total dollar risk stays flat.
The main methods
- Probe + confirmation (three-phase): The professional standard. Probe enters at the setup signal, confirmation add fires on a defined market event (e.g., a close above resistance), and the final add comes on confluence (volume surge, VWAP reclaim, or structure break). Best for trending markets with clear structure.
- Equal increments: Divide the full position into equal lots and add at fixed price intervals (e.g., every 0.5 ATR). Simple to execute, but the average entry improves less than with confirmation-based adds. Suits liquid, range-bound instruments.
- Percentage splits (25/50/25 or 20/30/50): A common tranche structure that keeps the probe small, loads the bulk of size at confirmation, and uses the final tranche to top up on strong momentum. The 20/30/50 variant is aggressive and suits fast-trending instruments.
- Pyramiding into winners: Each successive tranche is smaller than the last (e.g., 50/30/20). Average cost stays closest to the initial entry, and the position grows without meaningfully raising average price. Requires a trailing stop on the full position.
- Averaging down (not a scale-in strategy): Adding to a losing position is categorically different from scaling in. It increases exposure when the thesis is being disproved and should not appear in any disciplined scale-in plan.
Method comparison
| Method | Best regime | Liquidity requirement | Time frame |
|---|---|---|---|
| Probe + confirmation | Trend regime | Moderate to high | Intraday to swing |
| Equal increments | Mean-reversion, range | High | Intraday |
| Percentage splits (25/50/25) | Trend or breakout | Moderate | Swing to position |
| Pyramiding (50/30/20) | Strong trend regime | Moderate to high | Swing to position |
| Averaging down | None (avoid) | Any | Any (high risk) |
Three-tranche worked calculation
Assume a $50,000 account, a 1% per-trade risk cap ($500 total risk), and a stock trading at $100.00 with a full-position invalidation stop at $98.00 (a $2.00 risk per share).
- Full target size: $500 ÷ $2.00 = 250 shares
- Tranche 1 (40%): 100 shares at $100.00, stop at $98.00 (dollar risk: $200)
- Tranche 2 (40%): 100 shares at $101.00, stop tightened to $99.50 (combined risk: 100 × $1.50 + 100 × $1.50 = $300 total)
- Tranche 3 (20%): 50 shares at $102.00, stop tightened to $100.50 (combined risk: 100 × $0.50 + 100 × $1.50 + 50 × $1.50 = $275 total, within the $500 cap)
- Weighted average entry: (100 × $100 + 100 × $101 + 50 × $102) ÷ 250 = $100.80
Total dollar risk never exceeded $500. The average entry of $100.80 is better than a single fill at $102.00 would have been.
How to build a scale-in plan before you trade
A scale-in plan written before the session is the only kind that works. Decisions made in real time, while a position is moving, are almost always emotional. The plan locks in the rules so execution becomes mechanical.
Pre-trade decisions to lock in
- Maximum total dollar risk (R): State the exact dollar amount you will risk on this trade across all tranches. This number does not change after the probe is filled.
- Number of adds allowed: Decide the maximum number of tranches (typically two or three). More adds mean more complexity and more commission drag.
- Tranche sizes: Write the share or contract count for each tranche before placing the first order. Use a percentage split (e.g., 40/40/20) derived from your full position size.
- Confirmation signals: Define the exact market event that triggers each add. "It looks strong" is not a confirmation signal. "A 15-minute close above $101.50 with volume above the 20-period average" is.
- Stop-placement logic: State where the stop moves after each add. The stop must tighten enough that combined open risk stays at or below your original R.
- Daily loss cap: Set a session-level limit (e.g., 2% of account) at which you stop trading for the day, regardless of open positions.
Sample trade-plan template
Fill in every field before placing the probe:
- Instrument: ___
- Thesis (one sentence): ___
- Full position size (shares/contracts): ___
- Per-trade risk cap ($R): ___
- Tranche 1: Size ___, Entry trigger ___, Initial stop ___
- Tranche 2: Size ___, Confirmation signal ___, Stop after add ___
- Tranche 3 (if used): Size ___, Confirmation signal ___, Stop after add ___
- Profit target(s): ___
- Scale-out rule: ___
- Max daily loss cap: ___
- Invalidation condition (cancel all adds): ___
A process-oriented trading approach treats this template as non-negotiable. If you cannot fill in every field, the trade does not qualify for scaling.
Pre-trade checklist
- Per-trade dollar risk is defined and within account limits
- All tranche sizes are calculated and written down
- Each add trigger is a specific, observable market event
- Stop levels after each add are computed and will keep total risk ≤ R
- Daily loss cap is set and enforced
- Invalidation condition is defined (what would cancel all remaining adds)
- Orders are staged or alerts are set — no manual guessing during the trade
Risk controls: keeping dollar risk constant as the position grows
The constant-risk principle is the mathematical backbone of disciplined scaling. Every time you add a tranche, you must tighten the stop on the existing position so that total open dollar risk across all tranches stays at or below your original R. This is not optional.
Worked example of the constant-risk math:
- Original R: $500
- Tranche 1: 100 shares, entry $100.00, stop $98.00 → open risk $200
- After Tranche 2 (100 shares at $101.00): to keep total risk ≤ $500, the combined stop must satisfy: 200 × (entry_avg − stop) ≤ $500. Move the stop to $99.50 → risk = 100 × $0.50 + 100 × $1.50 = $200. Total: $200. Still within budget.
The constant-risk rule means a winning trade can grow in size without growing in risk. That is the core mechanical advantage of scaling in over a single large entry.
Position-sizing formula:
Shares per tranche = (Account equity × Risk % per trade × Tranche weight) ÷ (Entry price − Stop price)
For a $50,000 account, 1% risk, 40% first tranche, $2.00 stop distance: (50,000 × 0.01 × 0.40) ÷ 2.00 = 100 shares.
Operational risk rules to enforce:
- Stop tightening is mandatory with each add. Never add a tranche without simultaneously moving the stop.
- Maximum adds: Three tranches is the practical ceiling for most retail traders. More adds multiply commission costs and execution complexity.
- Symbol exposure cap: No single position should exceed 5–10% of account equity in total notional exposure, regardless of how many tranches are filled.
- Portfolio correlation cap: If two open positions are highly correlated (e.g., two tech stocks in the same sector), their combined R counts against a single risk budget.
- Daily loss cap: A complete scale map includes a daily risk ceiling. Once hit, no new adds are permitted for the session.
Statistic callout: A scale-in discipline reduces initial maximum adverse excursion and can improve weighted average entry, but it increases order counts and transaction costs — traders must weigh better fills against higher commission drag on every additional tranche.
Scaling out: partial exits that protect profits without capping upside
Scaling out is where most traders leave money on the table, not because they exit too early, but because they exit without a plan. A partial-exit framework removes the in-session decision entirely.
Common partial-exit frameworks:
- 50/50: Sell half the position at the first profit target (typically 1R or a key resistance level), move the stop to breakeven on the remainder, and trail the second half. Simple, beginner-friendly, and widely used by day traders.
- 1/3–1/3–1/3: Exit one-third at 1R, one-third at 2R, and trail the final third with a moving stop. Captures more of a trend while locking in gains progressively.
- ATR-based trailing: After the first partial, trail the remaining position by a fixed ATR multiple (e.g., 2× ATR on the daily). Adapts to volatility rather than fixed price levels.
When scale-out reduces expectancy: Exiting too early on a strong trend cuts the right tail of your return distribution. If your strategy's edge comes from occasional large winners, a rigid 50/50 exit can lower average R per trade. Test your exit rules in backtesting before assuming partial exits always help.
Example exit plan for a swing trade:
- Entry: 200 shares at $100.00, stop at $98.00 (R = $400)
- Target 1 (1R = $102.00): Sell 100 shares, move stop to $100.00 (breakeven on remainder)
- Target 2 (2R = $104.00): Sell 50 shares
- Remainder (50 shares): Trail with 1.5× ATR daily stop until stopped out
Pro Tip: Size the first partial so the remaining position covers its own risk. If you sell enough at Target 1 to bank the original R in cash, the remaining shares are effectively a "free trade" — your worst outcome from that point is breakeven on the full position.
How to backtest scaling strategies without fooling yourself
Most backtest results for scaling strategies are optimistic because they assume perfect fills at every tranche level. Real markets gap, spread, and partially fill. A trustworthy backtest models order-level behavior, not just price levels.
Testing methodology:
- Simulate each tranche as a separate order with its own fill logic, slippage estimate, and commission.
- Use realistic slippage: at minimum, add half the average spread to each fill price. For less liquid instruments, model market-impact slippage separately.
- Test across multiple market regimes (trending, ranging, high-volatility) to see whether the scaling method's edge is regime-dependent.
- Avoid look-ahead bias: confirmation signals must be evaluated on the bar's close, not its intrabar high or low.
Key metrics to track:
- Expectancy (R): Average profit per trade expressed as a multiple of R. A positive expectancy after all costs is the minimum bar.
- Profit factor: Gross profit ÷ gross loss. Above 1.5 is generally considered a meaningful edge.
- Return-to-drawdown ratio: Total return ÷ maximum drawdown. Scaling strategies that add size can amplify drawdowns; this ratio keeps that in view.
- Max adverse excursion (MAE) per tranche: How far each tranche moved against you before the trade recovered. High MAE on Tranche 1 suggests the probe entry is too early.
- Realized slippage cost: Total slippage across all tranches as a percentage of gross profit. If slippage consumes more than 20–30% of gross profit, reduce the number of tranches or widen tranche spacing.
Example test result layout:
| Metric | What to look for | Red flag |
|---|---|---|
| Expectancy (R) | Positive after costs | Negative or near zero |
| Profit factor | Above 1.5 | Below 1 |
| Return-to-drawdown | Above 2 | Below 1 |
| MAE per tranche | Decreasing with each add | Rising MAE on later tranches |
| Realized slippage | Below 20% of gross profit | Above 30% of gross profit |
Backtests that ignore slippage, partial fills, and realistic execution logic overstate the benefit of scaling. Model order-level behavior to get trustworthy results.
Execution tools and order types for reliable scaling
The right order types reduce slippage, prevent emotional overrides, and make the scale-in plan mechanical. Choosing the wrong order type for a tranche can cost more than the average-entry improvement is worth.
Order types for scaling:
- Limit orders: The default for planned tranches at pre-defined price levels. Guarantee price but risk non-fill if the market moves through the level without pausing.
- OCO (one-cancels-other) / bracket orders: Pair a limit entry with a stop-loss on the same order. When the entry fills, the stop is live immediately. Useful for Tranche 1 so the probe is always protected.
- Time-weighted limit ladders: Place multiple limit orders at staggered price levels within a defined time window. Reduces market impact on larger positions in moderately liquid instruments.
- Iceberg orders: Available on most futures and equity platforms; display only a small portion of the total order size to reduce market impact. Relevant when the full tranche size is large relative to average volume.
Automation considerations:
Automated bracket orders and conditional order logic (available on platforms like NinjaTrader, TradeStation, and Interactive Brokers) can enforce the scale-in plan without manual intervention. The tradeoff: automated laddering requires precise pre-trade setup and can misfire if market conditions change rapidly. Manual adds give more discretion but open the door to behavioral override.
For traders running the same strategy across multiple accounts or prop firm evaluations, trade-copier tools can replicate scale-in orders across platforms simultaneously, keeping sizing consistent. Consistent sizing across accounts is a separate discipline — one worth reviewing before scaling a strategy beyond a single account.
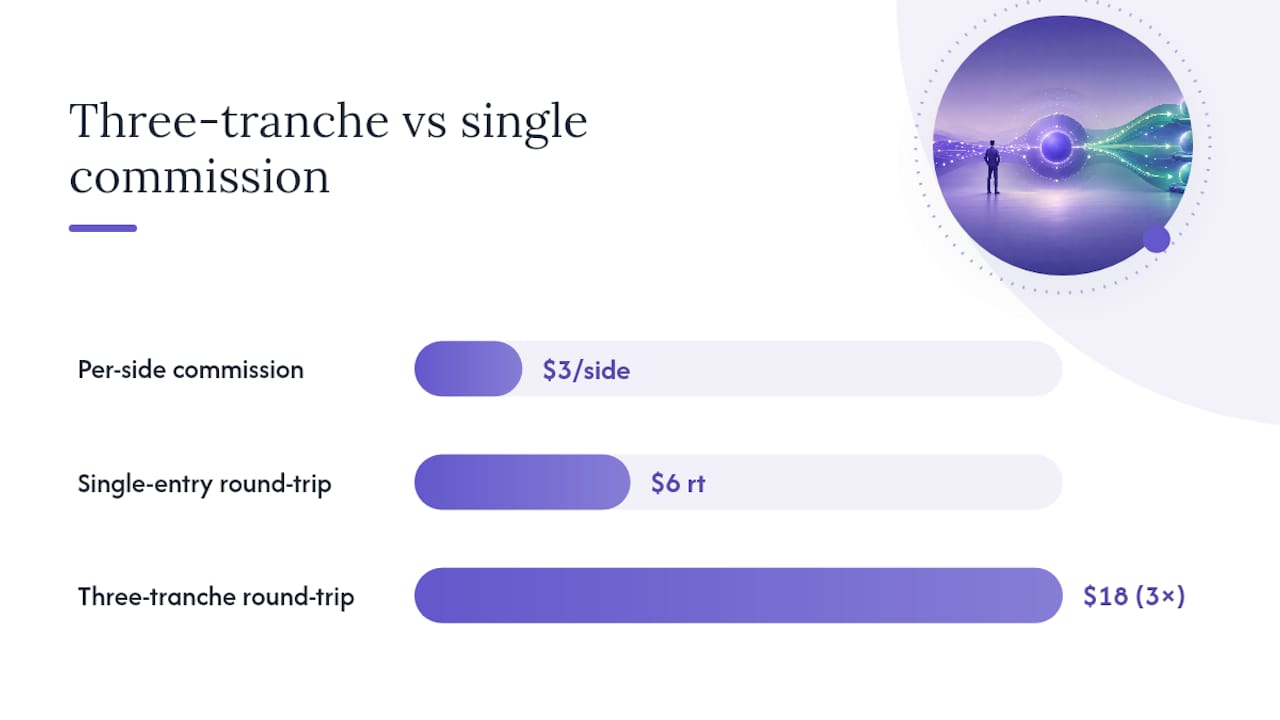
Execution cost note: Each additional tranche adds commission and spread cost. For a three-tranche scale-in versus a single entry, you pay roughly three times the commission. On a $500 R trade with $3 per-side commission, three tranches add $18 in round-trip costs. Keep tranche count low enough that execution costs do not materially erode expectancy.
Trader psychology and the mistakes that make scaling fail

Scaling in is a rules-based technique. When it fails, the cause is almost always behavioral, not structural. The trade log usually shows the pattern clearly in hindsight.
Common behavioral errors:
- Adding to losers: The most destructive mistake. A position moving against you is not a confirmation signal; it is a warning. Adding size to a losing trade is averaging down, not scaling in.
- Adding too early: Entering Tranche 2 before the confirmation signal fires, because the trade "looks like it's about to move." Early adds raise average cost without the market's endorsement.
- Ignoring the constant-risk rule: Adding a tranche without tightening the stop. This silently doubles or triples open dollar risk while the trader believes they are following the plan.
- Size creep: Gradually increasing tranche sizes after a string of winners, until the position is far larger than the original plan allowed.
- Revenge trading: Taking an oversized scale-in after a stop-out, trying to recover losses in a single trade.
Behavioral mitigation tactics:
- Pre-commit the full trade plan in writing before the session. A trading journal that captures the plan and the actual execution side by side makes deviation visible.
- Set automated alerts or conditional orders for each tranche trigger. If the confirmation signal has not fired, the order does not exist.
- After three consecutive stopped-out scale-in attempts, pause and review the confirmation signal logic before continuing.
- Watch for emotional justification language in your own notes: "I'm adding because I feel confident" or "the market has to bounce here." These phrases are red flags, not reasons.
In-session red flags:
- You are considering an add but the price is below your probe entry.
- The stop you planned to set after the add would be wider than the original stop.
- You have already hit your daily loss cap but are looking for a reason to take one more trade.
Any one of these conditions should cancel all remaining planned adds for the session.
How decision-intelligence tools help traders scale in consistently
The hardest part of scaling in is not knowing the rules. It is following them when a position is live and the market is moving. Decision-intelligence platforms address that gap by scoring the decision itself, not the outcome.
Eialgos is a Decision Intelligence platform built for self-directed traders. It scores each trade setup using a six-factor analytical engine that evaluates the psychological and behavioral quality of the decision. It does not provide trade signals or specific trade recommendations. Its role is to surface whether your decision process meets the standards you set for yourself — before you press the button.
For scaling specifically, a platform like Eialgos can:
- Enforce the pre-trade checklist: A decision score that requires all tranche levels, confirmation signals, and stop levels to be defined before the probe is placed.
- Flag constant-risk violations: If a planned add would push total open dollar risk above the original R, the scoring engine surfaces that conflict before the order is submitted.
- Prompt stop adjustments: Live trade management tools can remind you to tighten the stop before the next tranche is added, turning a rule you might forget under pressure into a prompted action.
- Track behavioral patterns over time: The LIANA assistant identifies whether you consistently add too early, skip stop tightening, or deviate from tranche sizes — and feeds that back as a coaching insight, not a trade signal.
The Eialgos platform is designed around the idea that better decisions, made consistently, produce better outcomes over time. For scaling strategies, where the behavioral failure modes are specific and well-documented, that kind of structured decision support is worth more than any signal.
Worked numerical examples and templates
Example 1: Day-trade scale-in (intraday, equities)
Setup: Stock breaking above a pre-market high of $205.00. Account: $30,000. Invalidation stop: $203.50 ($1.50 below the breakout level).
- Full position size: $300 ÷ $1.50 = 200 shares
- Tranche 1 (50%, 100 shares): Buy at $205.00 on the breakout candle close. Stop at $203.50. Open risk: $150.
- Tranche 2 (50%, 100 shares): Buy at $206.00 if the next 5-minute candle closes above $205.80 with above-average volume. Tighten stop to $204.50. Combined risk: 100 × $1.50 + 100 × $1.50 = $300. Within cap.
- Exit: Sell 100 shares at $207.50 (1R target). Trail remaining 100 shares with a 2-minute close below the 9 EMA.
- Weighted average entry: (100 × $205 + 100 × $206) ÷ 200 = $205.50
- P&L on first partial (100 shares, $207.50 exit): $200 gain. Remaining 100 shares trailed to $206.80 stop: $130 gain. Total: $330 on a $300 risk.
Example 2: Swing-trade scale-in (multi-day, equities)
Setup: Stock pulling back to the 20-day moving average in an uptrend. Account: $50,000. Invalidation stop: $97.00 (below the prior swing low). Current price: $100.00.
- Target 1 (1R above avg entry, ~$103.10): Sell 125 shares. Move stop to $101.10 (breakeven).
- Target 2 ($105.00): Sell 75 shares.
- Remaining 50 shares: Trail with 1.5× ATR daily stop.
Compact spreadsheet layout
Copy this into any spreadsheet to track a scale-in in real time:
- Column A: Tranche number
- Column B: Shares/contracts
- Column C: Entry price
- Column D: Stop price after add
- Column E: Open dollar risk (B × |C − D|)
- Column F: Cumulative risk (sum of E)
- Column G: Weighted average entry (running)
- Column H: Confirmation signal fired? (Y/N)
Adapting to account size and liquidity: For smaller accounts (under $10,000), two tranches are usually sufficient. For low-liquidity instruments, widen ATR-based spacing between tranches to avoid moving the market with your own orders.
The part most scaling guides get wrong
Most articles on scaling in treat it as an entry optimization technique. Get a better average price, reduce initial exposure, manage risk. All true. But that framing misses the harder problem: scaling in is a behavioral discipline disguised as a mechanical one.
The math is straightforward. The constant-risk rule is not complicated. The three-phase structure is not difficult to understand. What is difficult is executing it correctly when you are in a live trade, the position is moving against you on Tranche 1, and your brain is generating reasons why adding now makes sense. That is the moment the plan either holds or it doesn't.
The conventional advice says "follow your rules." That is correct and useless. The more honest guidance is this: the plan must be written in enough detail that following it requires no judgment at all. Every add trigger is a binary observable event. Every stop level is a number, not a zone. Every tranche size is a share count, not a range. When the plan is that specific, behavioral override becomes visible immediately — you either did the thing or you didn't.
The second thing most guides underweight is the cost of adding tranches. Better average entry is real. But three fills instead of one means three commissions, three spreads, and three opportunities for slippage. On a small account or a tight-margin strategy, those costs can consume a meaningful portion of the edge. The right number of tranches is not always three. For many retail traders on smaller accounts, two tranches with a clean confirmation signal outperforms a three-tranche ladder after costs.
Finally: test your scaling rules before you trade them live. Not a casual review of a few charts. A proper backtest with realistic slippage, partial fills, and commission modeled at the order level. The strategies that survive that test are the ones worth trading.
This article is general information, not a substitute for advice from a qualified financial advisor. Consult a qualified financial professional about your own circumstances before acting on anything here.
Sources
The sources below were used throughout this guide. Each one targets a specific need:
- Scale In: Building Position Size Through Confirmation - NexusFi Academy
- Quantstrategy
- Scaling Strategies | Trading Glass
- Scale In and Out: Trading Strategies for Position Management
- Scale-In — Investopedia