
Your risk of ruin (RoR) is the probability your bankroll drops below the minimum needed to keep trading or playing. The single most effective guard: cap risk per trade at 1–2% of equity. At 2% risk per trade, RoR drops to approximately 0.04% for many positive-expectancy strategies. At 5%, you are not five times more exposed. You are orders of magnitude closer to ruin.
That nonlinearity is the whole point. A profitable strategy with a genuine edge can still destroy an account if position sizing is too aggressive. Variance does not care about your win rate. It will find the worst sequence of losses and arrive there faster than you expect when bet sizes are large.
- Risk of ruin measures the probability of permanent depletion, not a temporary setback.
- The primary lever is position size, not win rate.
- Even a strong edge offers no protection when sizing is reckless.
Table of Contents
- What risk of ruin actually measures, and how it differs from drawdown
- How to calculate risk of ruin: inputs, formulas, and when to use each
- Worked examples that show how bankroll, edge, and bet size change your RoR
- How to read your RoR result and decide what level of risk fits you
- Practical steps to reduce and manage your risk of ruin
- Tools, spreadsheets, and calculators to compute RoR quickly
- Why behavioral failures drive more ruin events than bad math
- Key Takeaways
- The mental framework experienced traders use for RoR
- How Eialgosinc helps you lower the behavioral drivers of ruin
- Useful sources and further reading
What risk of ruin actually measures, and how it differs from drawdown
Drawdown and risk of ruin are related but not the same thing. Drawdown is a peak-to-trough measurement. It tells you how far an account fell from its high. It is temporary by definition. Risk of ruin is a probability statement: given your strategy's parameters, what are the odds your account hits a threshold from which recovery is no longer realistic?
Professionals typically set that threshold at a significant fraction of starting capital, though the exact number depends on context. What matters is that once you cross it, the math of recovery becomes brutal. A 50% loss requires a 100% gain to break even.
In negative-EV games, ruin is mathematically certain over an infinite timeline. No bankroll size prevents it. Only a genuine positive edge makes ruin probabilistically avoidable, and even then, position sizing determines whether you survive long enough to let that edge work.
What RoR depends on:
- Win rate (p) and loss rate (q)
- Risk-reward ratio per trade or bet
- Volatility and variance of outcomes
- Position size as a fraction of total equity
- Time horizon (finite vs. infinite)
Industry benchmark: Professionals target RoR below 1%. Many calculator tools and published guides treat 1% as the upper bound for serious traders and advantage players. Recreational tolerances extend to 5%, but anything above that is speculative territory.
The practical difference between drawdown and ruin is survivability. A strategy can endure a 30% drawdown and recover if sizing is controlled. The same strategy with oversized positions can hit the same 30% loss and find the account too small to trade the next setup at a meaningful size. That is effective ruin even if the account is not technically at zero.
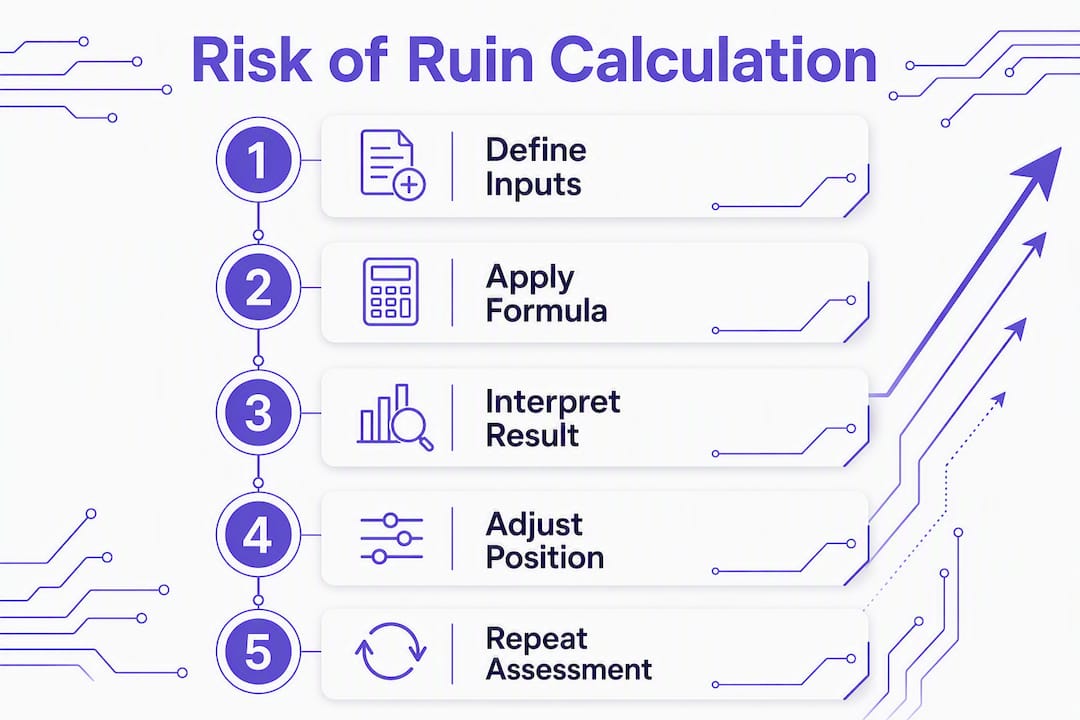
How to calculate risk of ruin: inputs, formulas, and when to use each
Every RoR calculation starts with the same core inputs.
Required inputs:
- Win rate (p) and loss rate (q = 1 − p)
- Payoff ratio (average win divided by average loss, or R:R)
- Risk per trade as a fraction of equity (f)
- Bankroll expressed in units (total equity divided by risk per unit)
- Time horizon: finite (fixed number of trades) or infinite
The Sileo/Schlesinger infinite-horizon formula is the standard for flat-betting advantage players:
RoR = ((1 − α) / (1 + α))^B
Where α = advantage / variance (a dimensionless ratio of edge to variability) and B = bankroll in units. RoR decays exponentially as B increases, which is why doubling your bankroll in units cuts ruin probability far more than doubling it in raw dollars.
Simplified discrete formula for binary outcomes (fixed win/loss, equal bet sizes):
RoR ≈ ((q/p))^N
Where N = number of units to ruin. This works cleanly for coin-flip-style bets but becomes inaccurate when trade sizes vary or the outcome distribution has heavy tails.
Monte Carlo simulation is the practical choice for real trading, where outcomes are not binary and bet sizes shift. The method: shuffle your actual trade history thousands of times, run each sequence forward, and count how many paths hit the ruin threshold. A minimum of 100 trades of representative history and 5,000–10,000 shuffles gives reliable estimates.
Assumptions behind closed-form formulas:
- Trials are independent (no correlation between consecutive trades)
- Bet size is fixed across all trials
- Edge is stationary (does not degrade over time)
- Outcome distribution is not heavy-tailed
When any of those assumptions break down, closed-form answers are optimistic. Real markets have correlated losing streaks, variable sizing, and edge that drifts.
Pro Tip: If you have fewer than 100 trades of history, skip the closed-form formula entirely. Use conservative sizing (1% risk per trade) and run Monte Carlo with a variance estimate 20–30% wider than your sample suggests. Small samples systematically underestimate tail risk.
Worked examples that show how bankroll, edge, and bet size change your RoR
Numbers make this concrete. Three examples below, each showing how a single variable shift changes the outcome dramatically.
Example A: Trader with 50% win rate, 1:1.5 R:R
Assume a trader with a 50% win rate and average wins larger than average losses. This is a positive-expectancy setup.

| Risk per trade | Bankroll in units | Approximate RoR |
|---|---|---|
| 5% | 20 units | — |
| 2% | 50 units | — |
| 1% | 100 units | Negligible |
Moving from 5% to 2% risk per trade can reduce RoR by 90% or more in typical positive-expectancy scenarios. The relationship is not linear. It is exponential.
Example B: Advantage gambler using the Schlesinger formula
An advantage player has a small edge over the house relative to variance. With a sufficiently large bankroll in units, the RoR can be brought down to well below 1%. Doubling the bankroll in units significantly drops ruin probability due to its exponential decay.

At smaller bankroll units, RoR is substantially higher. Doubling the bankroll in units drops ruin probability by a large margin, illustrating the exponential decay the Schlesinger formula captures.
Calculator inputs to copy: edge (as a decimal), variance, bankroll in units. Online unit-based calculators accept these directly and return RoR with no manual computation.
Example C: Monte Carlo sketch for variable-size trades
A trader exports trades with variable sizes and outcomes. Monte Carlo simulation considering variable trade sizes reveals significantly different RoR estimates compared to fixed-size formula approaches, highlighting the importance of simulating actual trade variation. Same edge, same history, different sizing discipline.
Interpretation within each example: if your RoR exceeds 5%, reduce position size before running another trade. If it sits between 1–5%, tighten sizing and run Monte Carlo on your most recent 100 trades. Below 1%, you are in professional-safe territory, but monitor for edge degradation.
How to read your RoR result and decide what level of risk fits you
A number without context is just a number. Here is how to use it.
Guideline bands:
- Below 0.5%: negligible risk; appropriate for professionals with consistent edge
- 0.5–1%: professional-safe; the target for serious traders and advantage players
- 1–5%: moderate; acceptable for recreational play with money you can afford to lose
- Above 5%: high; reduce position size before continuing
These bands assume the model's assumptions hold. They often do not.
A calculated RoR of 0.8% can be dangerously misleading if your trades are correlated (sector-concentrated positions that all lose together), if you use leverage that amplifies tail events, or if your edge has degraded since you collected the sample data. The formula does not know any of that.
Decision rules:
- If RoR exceeds 5%: reduce risk per trade immediately, no exceptions.
- If RoR sits between 1–5%: run Monte Carlo on your last 100 trades before the next session.
- If your recent win rate has dropped by more than 5 percentage points from your baseline: pause and reassess edge before sizing up again.
- If you have added leverage or changed instruments: recalculate from scratch.
The goal is not a perfect number. It is protecting your ability to trade another day. An account that survives a bad month can recover. One that hits the ruin threshold cannot.
Practical steps to reduce and manage your risk of ruin
These are the controls that actually move the number.
-
Cap risk per trade at 1–2% of equity. This single rule, applied consistently, pushes RoR toward negligible levels for any positive-expectancy strategy. It is the highest-leverage change available.
-
Use fractional Kelly sizing. Full Kelly maximizes long-run growth but produces extreme volatility. Fractional Kelly, typically at 25–50% of the full Kelly fraction, dramatically reduces RoR while preserving growth trajectory. Most professionals use half-Kelly or less.
-
Set a hard daily or session loss limit. A 3–5% daily loss limit stops a bad day from becoming a catastrophic one. Write it down before the session starts. Automate it if your platform allows.
-
Maintain a non-trading cash reserve. Keep at least 20–30% of total capital outside your active trading account. This reserve prevents a drawdown from forcing you to trade undersized or emotionally.
-
Diversify across uncorrelated strategies or instruments. Correlated positions do not reduce RoR. They concentrate it. If three positions all respond to the same macro event, you effectively have one large position.
-
Monitor your equity curve weekly. A declining equity curve is an early warning that edge may be degrading. Set a trigger: if the curve breaks below a 10% trailing threshold, reduce size by half until you diagnose the cause.
-
Use pre-commitment rules to prevent revenge trading. Decide your daily loss limit, your maximum position size, and your stop-trading trigger before markets open. Decisions made under loss aversion are systematically worse than decisions made in advance.
Pro Tip: Automate what you can. Brokers like Interactive Brokers and TD Ameritrade allow pre-set position size limits and daily loss alerts. Use them. A rule you enforce manually is a rule you will break when it matters most.
- Review your process, not just your P&L. A profitable week built on oversized, lucky trades raises RoR. A losing week built on disciplined, correctly sized trades does not. Tracking process-oriented trading metrics alongside P&L separates skill from noise.
Tools, spreadsheets, and calculators to compute RoR quickly
You do not need to solve the formula by hand.
Online calculators:
- Provably Smart's RoR calculator accepts unit-based inputs and applies the Schlesinger formula directly. Useful for advantage gamblers and flat-betting traders.
- The Planet Indicator's guide includes worked examples and links to spreadsheet-based approaches for traders with variable trade sizes.
Spreadsheet approach (Excel or Google Sheets):
Convert your account to units: Units = Account Balance / Risk Per Trade. Then apply the discrete formula in a cell: =((q/p)^N) where q = loss rate, p = win rate, N = units to ruin. For variable-size trades, build a simulation column that randomly reorders your trade history using =INDEX(range, RANDBETWEEN(1, COUNT)) and tracks cumulative equity across 5,000 iterations using a data table.
Monte Carlo in Python (3 lines of logic):
Shuffle your trade returns array, run cumulative sum, check if it crosses the ruin threshold. Repeat 10,000 times. Count the fraction of runs that hit ruin. That fraction is your Monte Carlo RoR estimate.
Step-by-step workflow:
- Export trade history from your journal (use a structured trading journal that exports to CSV).
- Normalize each trade to units (trade P&L divided by risk per trade).
- Run 5,000–10,000 shuffles of the normalized sequence.
- Track the percentage of runs that hit your ruin threshold.
- Recalculate after every 25–50 new trades.
At least 100 trades of representative history are needed before Monte Carlo results are trustworthy. Below that, widen your variance estimate and size conservatively.
Why behavioral failures drive more ruin events than bad math
The formula is not usually the problem. The execution is.
Systematic reviews link personality traits and behavioral biases directly to risky financial outcomes. Impulsivity, inconsistent sizing, and tilt after losses are major predictors of ruin, often more predictive than the underlying mathematical parameters of the strategy itself.
Ruin is as much a process failure as a math failure. Separating risks into market, credit, liquidity, and operational categories helps identify whether psychological tilt or process inconsistency is the real driver of elevated RoR.
Process failures compound the math. A trader who calculates a 0.5% RoR at 1.5% risk per trade but then sizes up to 4% after two losing trades has not changed their strategy. They have changed their actual risk profile in real time, without recalculating. Their live RoR is now far higher than their model suggests.
The behavioral levers that raise RoR in practice:
- Revenge trading after losses (abandoning pre-set size rules)
- Inconsistent execution (varying position size based on confidence rather than formula)
- Ignoring edge degradation signals (continuing to trade a strategy whose win rate has dropped)
- Poor record-keeping (no way to detect when parameters have shifted)
Weekly process checks reduce these risks. Review your last 20 trades: was sizing consistent? Did any trade exceed your stated risk limit? Did you exit early or hold past your plan? These questions surface behavioral drift before it shows up in the equity curve.
Eialgosinc's Decision Intelligence platform scores each trade setup on a six-factor behavioral engine, flagging inconsistencies in real time. The LIANA assistant identifies patterns across sessions, not just individual trades, which is where process drift is most visible. Structured decision scoring gives traders a feedback loop that raw P&L cannot provide.
Key Takeaways
Keeping risk per trade at 1–2% of equity is the single highest-leverage action for pushing risk of ruin below 1% in any positive-expectancy strategy.
| Point | Details |
|---|---|
| Cap risk per trade | Target 1–2% per trade; at 2%, RoR drops to approximately 0.04% for positive-expectancy strategies. |
| Use the right formula | Apply Schlesinger for flat-betting; use Monte Carlo with 5,000–10,000 shuffles for variable trade sizes. |
| Behavioral failures raise RoR | Revenge trading and inconsistent sizing often push live RoR far above the calculated model estimate. |
| Interpret results in context | A calculated RoR below 1% can be misleading if trades are correlated, leveraged, or edge has degraded. |
| Eialgosinc reduces behavioral RoR | The six-factor decision engine and LIANA assistant flag sizing inconsistencies and process drift before they compound. |
The mental framework experienced traders use for RoR
Most traders treat risk of ruin as a calculation they run once and file away. Professionals treat it as a constraint that governs every sizing decision, every day.
The shift in thinking is from "how much can I make?" to "how long can I survive?" Survivability is the prerequisite for profitability. A strategy with a 60% win rate and a 2:1 R:R is worth nothing if the account is ruined before the edge has time to express itself across enough trades.
Experienced traders set RoR as a hard ceiling, not a guideline. If a position would push RoR above 1%, they do not take it at full size. They either reduce size or pass. That discipline is boring. It also works.
There are situations where accepting a higher RoR is rational: a short-term, high-conviction strategy with a defined time horizon, where the trader is willing to risk a fixed portion of capital for a specific outcome. But that is a deliberate choice, made in advance, with a clear exit. It is not the same as drifting into elevated risk because sizing rules were abandoned after a losing streak.
How Eialgosinc helps you lower the behavioral drivers of ruin
Calculating RoR correctly is step one. Executing your sizing rules consistently under live market pressure is where most traders fail.
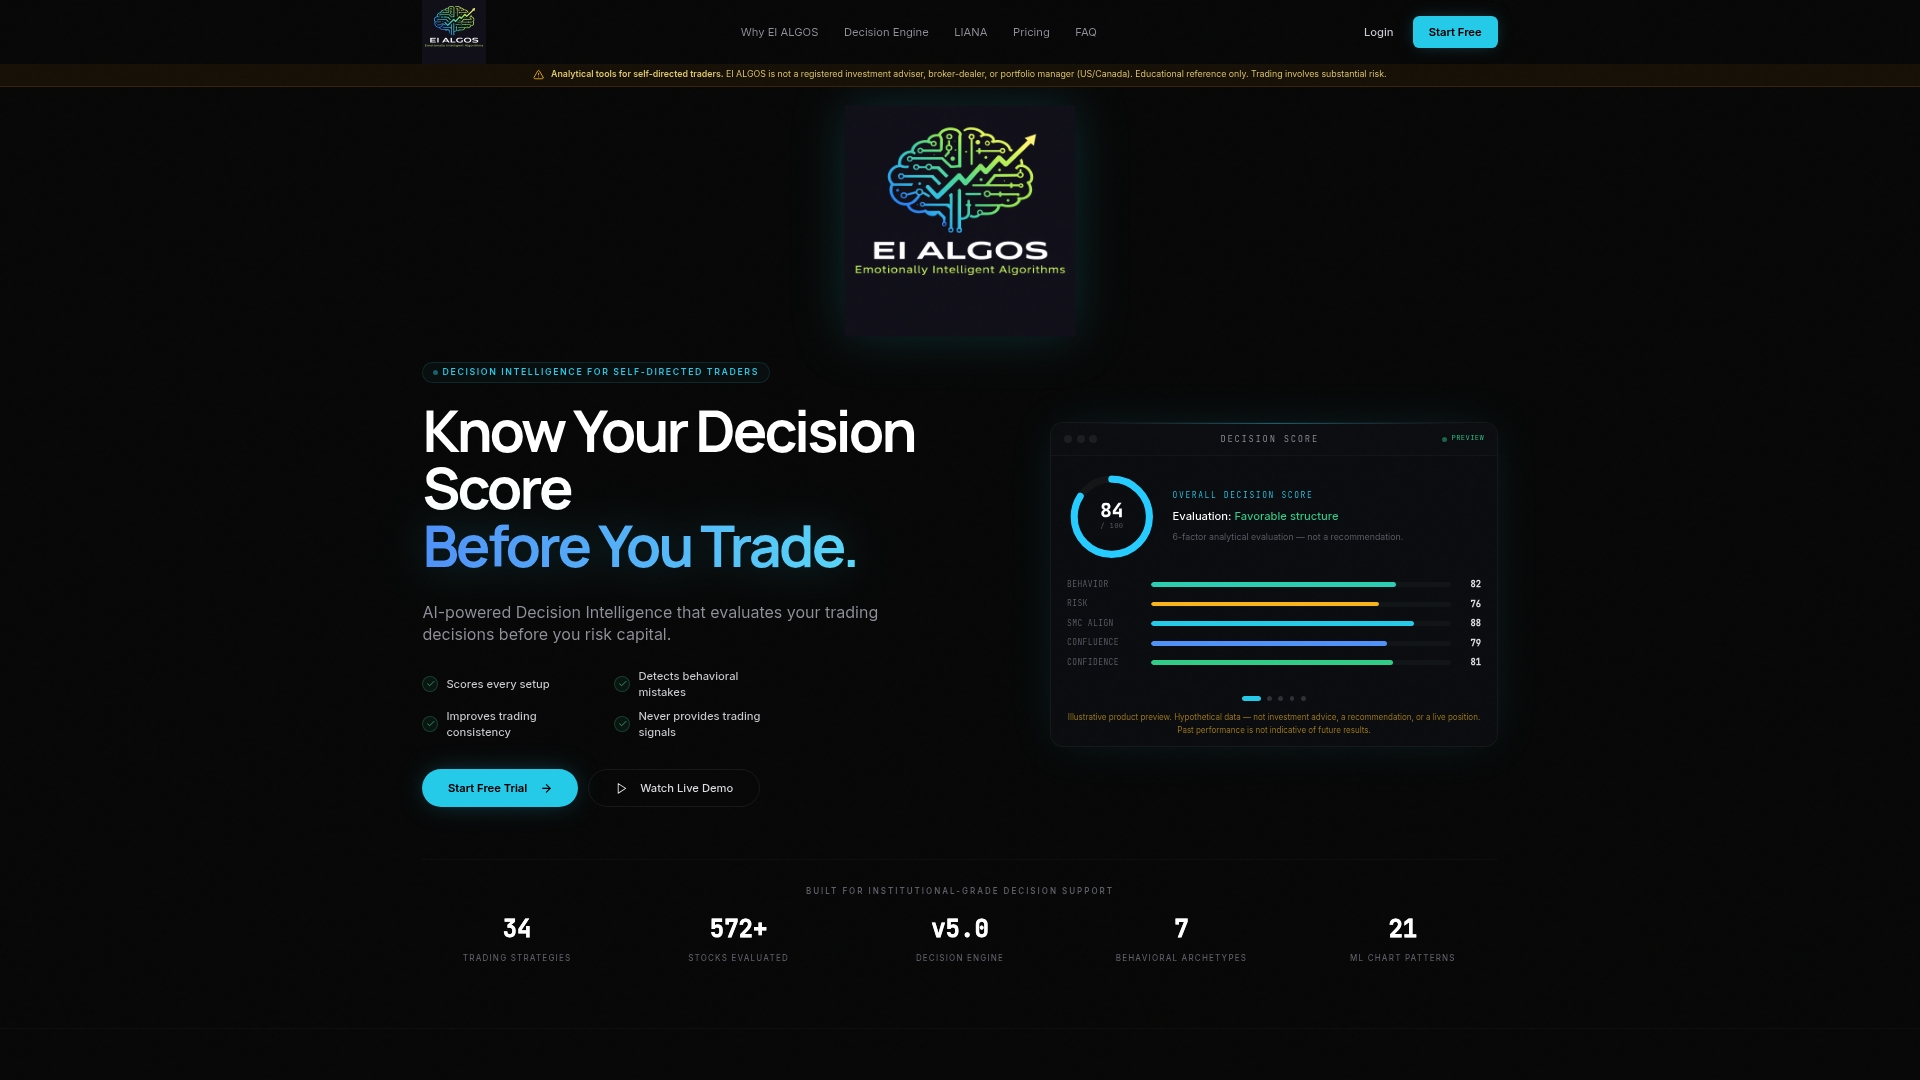
Eialgosinc's Decision Intelligence platform addresses that gap directly. Rather than providing trade signals, it scores your decision process on six behavioral and analytical factors before each trade, surfacing the psychological patterns that inflate real-world RoR: oversizing after losses, deviating from your plan under pressure, and ignoring edge degradation signals. The LIANA assistant tracks these patterns across sessions and delivers personalized feedback on where your process is breaking down.
The result is a feedback loop that keeps your live behavior aligned with your calculated risk parameters. Automated sizing checks, real-time behavioral flags, and weekly process reviews mean your actual RoR stays close to your modeled RoR, instead of drifting upward every time the market gets difficult.
Start with the EI ALGOS guide to see how decision scoring works, or explore subscription tiers to find the plan that fits your trading volume and goals.
Useful sources and further reading
Core theory and formulas:
-
Risk of ruin — Wikipedia: The foundational mathematical treatment, including the gambler's ruin problem, negative-EV certainty of ruin, and the role of positive expectancy. Start here for the theory.
-
Gambler's Ruin — University of Pittsburgh: Academic derivation of ruin probability for binary games. Useful if you want to understand where the formulas come from.
Calculators and practical tools:
-
Provably Smart RoR Calculator: Unit-based online calculator applying the Schlesinger formula. Best for advantage gamblers and flat-betting traders who want an infinite-horizon estimate without building a spreadsheet.
-
The Planet Indicator — Risk of Ruin Guide: Practical guide covering the 1–2% sizing rule, Monte Carlo methodology, and worked examples. Best for traders who want applied guidance alongside the math.
Behavioral and research context:
-
Gambling risk factors — UK Government umbrella review: Systematic review of behavioral and personality risk factors for harmful gambling. Relevant for understanding the human drivers of ruin beyond the formula.
-
Personality and gambling outcomes — Springer: Peer-reviewed systematic review linking impulsivity and behavioral biases to risky financial outcomes. Use this to understand why process controls matter as much as position sizing.
Financial risk management frameworks:
-
Financial risk management — Wikipedia: Overview of credit, market, liquidity, and operational risk categories. Useful for placing RoR within a broader risk management framework.
-
Financial risk management 101 — Thomson Reuters: Practitioner-level overview of risk identification and mitigation in financial services. Good context for traders building a formal risk framework.
Eialgosinc resources:
- Process-oriented trading guide: How to build a disciplined, repeatable trading process that keeps behavioral RoR low.
- EI ALGOS Decision Intelligence platform: Full product overview and feature descriptions.