
Profit factor is gross profit divided by gross loss over a set of trades. A result above 1 means the trades made money. A result of 1.5 means you earned $1.50 for every $1.00 you lost. The number is easy to compute and easy to misread, so this guide shows the formula, a worked example, what "good" looks like, and where the metric fails. It also covers the part most guides skip: your behavior decides the number long before the math does. That is why we built EI ALGOS around the decisions behind each trade, and why we score each setup before you take it.
TL;DR
- Profit factor = gross profit ÷ gross loss. Above 1 is profitable, exactly 1 is breakeven, below 1 is a losing record.
- Many sources treat roughly 1.5 to 2.0 as solid. Values between 1.1 and 1.3 leave little cushion once costs and bad conditions arrive.
- A very high profit factor on a small sample, or on a backtest without commissions and slippage, is a warning, not a result.
- Profit factor is the output of win rate, average win and average loss. Those three inputs come from your decisions, so that is where to improve it.
- Track it with win rate and expectancy, and review the trades that moved it most.
Table of Contents
- What profit factor measures
- How to calculate it: a worked example
- What profit factor values mean
- Why a high profit factor can mislead
- Profit factor, win rate and expectancy together
- Why your behavior moves the number
- How to use profit factor to improve, step by step
- What the metric cannot tell you
- Where EI ALGOS fits
- Our perspective
- FAQ
- Sources
What profit factor measures
Profit factor compares what your winning trades earned with what your losing trades cost. TradeStation's documentation defines it as Gross Profit divided by Gross Loss, says a value greater than 1 means positive net profit, and notes the calculation takes commissions into account, and slippage when you specify it for strategies.
Two terms matter here:
- Gross profit is the sum of all winning trades.
- Gross loss is the sum of all losing trades, taken as a positive number.
The AAII Journal describes the same ratio for a given period and says it usually falls between 1 and 4, where 1 is breakeven and 4 is very high and hard to sustain.
Profit factor is not a return figure. It says nothing about account size, drawdown or how long the trades lasted. It tells you how efficiently your risk turned into reward across the sample you measured.
How to calculate it: a worked example
Take 20 trades from one month:
- 8 winners averaging $400 each: gross profit of $3,200
- 12 losers averaging $200 each: gross loss of $2,400
Profit factor = $3,200 ÷ $2,400 = 1.33. Net profit is $800. Win rate is only 40%, yet the account grew, because the average win is twice the average loss.
Now flip it. A trader wins 14 of 20 trades (70%) with an average win of $100 and an average loss of $300 on the other 6.
- Gross profit: $1,400
- Gross loss: $1,800
- Profit factor: 0.78
That is a losing month despite a win rate most traders would envy. This is why win rate alone is a poor scorecard. We go deeper on that point in our guide to trader performance analysis beyond win rate.
The formula behind the formula
You can rewrite profit factor in terms of three things you control:
Profit factor = (win rate × average win) ÷ (loss rate × average loss)
In the first example: (0.40 × $400) ÷ (0.60 × $200) = 160 ÷ 120 = 1.33. This form matters because it shows exactly which lever to pull. Raise the average win, cut the average loss, or lift the win rate. Each lever is a decision: where you place the stop, when you take profit, which setups you accept.

What profit factor values mean
Use the ranges below as guidelines, not verdicts.
| Profit factor | What it tells you |
|---|---|
| Below 1.0 | Losses outweigh profits. The record loses money. |
| 1.0 | Breakeven before anything else goes wrong. |
| 1.1 to 1.3 | Thin edge. Costs or a rough stretch can erase it. |
| 1.3 to 1.5 | Workable if the sample is large and costs are included. |
| 1.5 to 2.0 | Solid for most discretionary and systematic styles. |
| Above 2.0 | Strong, but check sample size and costs before trusting it. |
The Algo Institute describes systems in the 1.1 to 1.3 range as structurally thin, with a cushion narrow enough that normal adverse conditions can push profitability to zero or below, and says systems above 2.0 carry substantial structural capacity. It also stresses that these ranges are guidelines and that profit factor is one diagnostic, not a standalone verdict.
Is 1.3 a good profit factor?
It is positive, but narrow. At 1.3 you keep $0.30 of every $1.00 lost, before you account for anything unexpected. If your numbers include real commissions and realistic fills, and the sample is large, 1.3 can be a base to build on. If they do not, treat it as unproven.
Is 1.5 or 1.8 good?
A 1.5 means $1.50 earned per $1.00 lost, and that is the level at which many traders start to feel comfortable. In his paper on evaluating trading systems, the author uses a 55% win rate with a profit factor of 1.5, measured on out-of-sample data, as the default description of a reasonably good system. A 1.8 is better still. The question to ask is not the number but how it was produced: how many trades, over what market conditions, after what costs.
Why a high profit factor can mislead
The most common mistake is trusting an impressive number that was never tested against reality. Four things inflate it.
1. Costs left out
The AAII Journal notes that commissions can dramatically cut profits or deepen losses for systems that generate many buy and sell signals. The effect is largest for active, small-target styles. Using the first example, suppose each of the 20 trades costs $15 round trip in commissions and fees. That adds $300 to the loss side: $3,200 ÷ $2,700 = 1.19. The same trades drop from 1.33 to 1.19 once the costs are counted.
2. Slippage
Slippage is the gap between the price where your signal appeared and the price where your order filled. The same AAII article says slippage must be accounted for when testing, or results are overstated, and that for end-of-day systems the first realistic fill is typically the next day's open. Fast markets, thin options contracts and market orders widen the gap.
3. Small samples
Ten trades can produce a profit factor of 3.0 from two lucky outliers. The metric stabilizes only as the number of trades grows and as the sample covers different conditions: trending weeks, choppy weeks, high-volatility days. If one trade supplies most of your gross profit, remove it and recompute. If the number collapses, you have a story, not a statistic.
4. Overfitting
When you tune a strategy's parameters until the backtest looks great, you often fit the noise of that specific history. The profit factor then drops on live data. The mesasoftware paper above insists on out-of-sample data for this reason: results from data the strategy never saw are the ones that count. Our write-up on the seven backtesting pitfalls that destroy live P&L covers this in detail.
Hypothetical results carry a regulatory flag too. In a 2016 enforcement action, the CFTC noted that solicitation materials lacked the disclaimer required by CFTC Regulation 4.41(b), which states that simulated or hypothetical performance has inherent limitations. When you see a stellar profit factor in marketing, ask whether it came from live trading or a simulation.
Profit factor, win rate and expectancy together
No single metric tells the whole story. Pair profit factor with these:
- Win rate: the share of trades that make money. It describes how often you are right, not how much it pays.
- Average win and average loss: the size of the payoff. Their ratio is your realized reward-to-risk.
- Expectancy: the average amount you make per trade. In the first example, $800 over 20 trades is $40 per trade.
- Maximum drawdown: the deepest peak-to-trough decline. A profit factor of 1.6 with a 40% drawdown may be unlivable.
The relationship between win rate and reward-to-risk is worth internalizing. A trader who wins 40% of the time needs winners that are comfortably more than 1.5 times the size of losers to break even, before costs. A trader who wins 70% can survive smaller winners, but only if the losers stay contained. Our guide to risk reward trading shows how to match a 1:1.5 to 1:3 target to your actual win rate. For a view that adds volatility to the picture, see Sharpe ratio trading.
Why your behavior moves the number
This is the part spreadsheets cannot show. Profit factor is a summary of choices. Look at what typically drags it down:
- Cutting winners early. Taking profit at the first twitch shrinks the average win and drops gross profit.
- Letting losers run. Moving or removing a stop inflates the average loss, which can erase dozens of small wins.
- Revenge trades. A trade taken right after a loss, outside your plan, often lands on the loss side of the ledger. We cover that moment in trading after a loss.
- Oversizing. One outsized loser can outweigh a month of disciplined trades.
- Taking B-grade setups. Entries that do not meet your own criteria add losers without adding winners. See our seven setup criteria for A+ entries.
If you only track the ratio, you see that it fell. You do not see why. The fix is to connect each trade to the decision that produced it, then look for the pattern. Our overview of behavioral trading explains how those patterns drive retail P&L.
How to use profit factor to improve, step by step
- Log every trade with costs. Record entry, exit, size, commissions, and the fill price versus the price you planned. Without actual fills, your profit factor is a guess.
- Compute it over a meaningful window. Use all trades for a single strategy or setup type, and avoid mixing styles. A swing-trade record and a scalping record answer different questions.
- Split it by setup, by day and by time of day. Overall profit factor can hide a profitable setup subsidizing an unprofitable one.
- Remove your best trade and recompute. If the result stays above 1, the edge does not depend on luck.
- Find the largest losers. Ask whether each one followed your rules. Rule-breaking losses are fixable, and they are the cheapest improvement available.
- Change one thing at a time. Adjust your stop placement, exit rule or setup filter, then measure the next batch of trades. Our trade exit rules and trade management strategies pages give frameworks you can apply.
- Review on a schedule. Weekly for process, monthly for statistics. Judge the decision quality of each trade, not only the outcome.
A caution on sizing: profit factor does not tell you how much to risk per trade. A strong ratio does not protect an account from oversized positions, so keep your risk per trade fixed and defined in advance.
What the metric cannot tell you
Profit factor is backward-looking. It describes the sample you gave it and says nothing certain about the next trade. Markets change, and an edge measured in one regime can fade in another. That is the reason to keep reviewing, to keep the sample honest, and to treat the number as one diagnostic among several. Trading involves risk of loss, and no metric removes it.
Where EI ALGOS fits
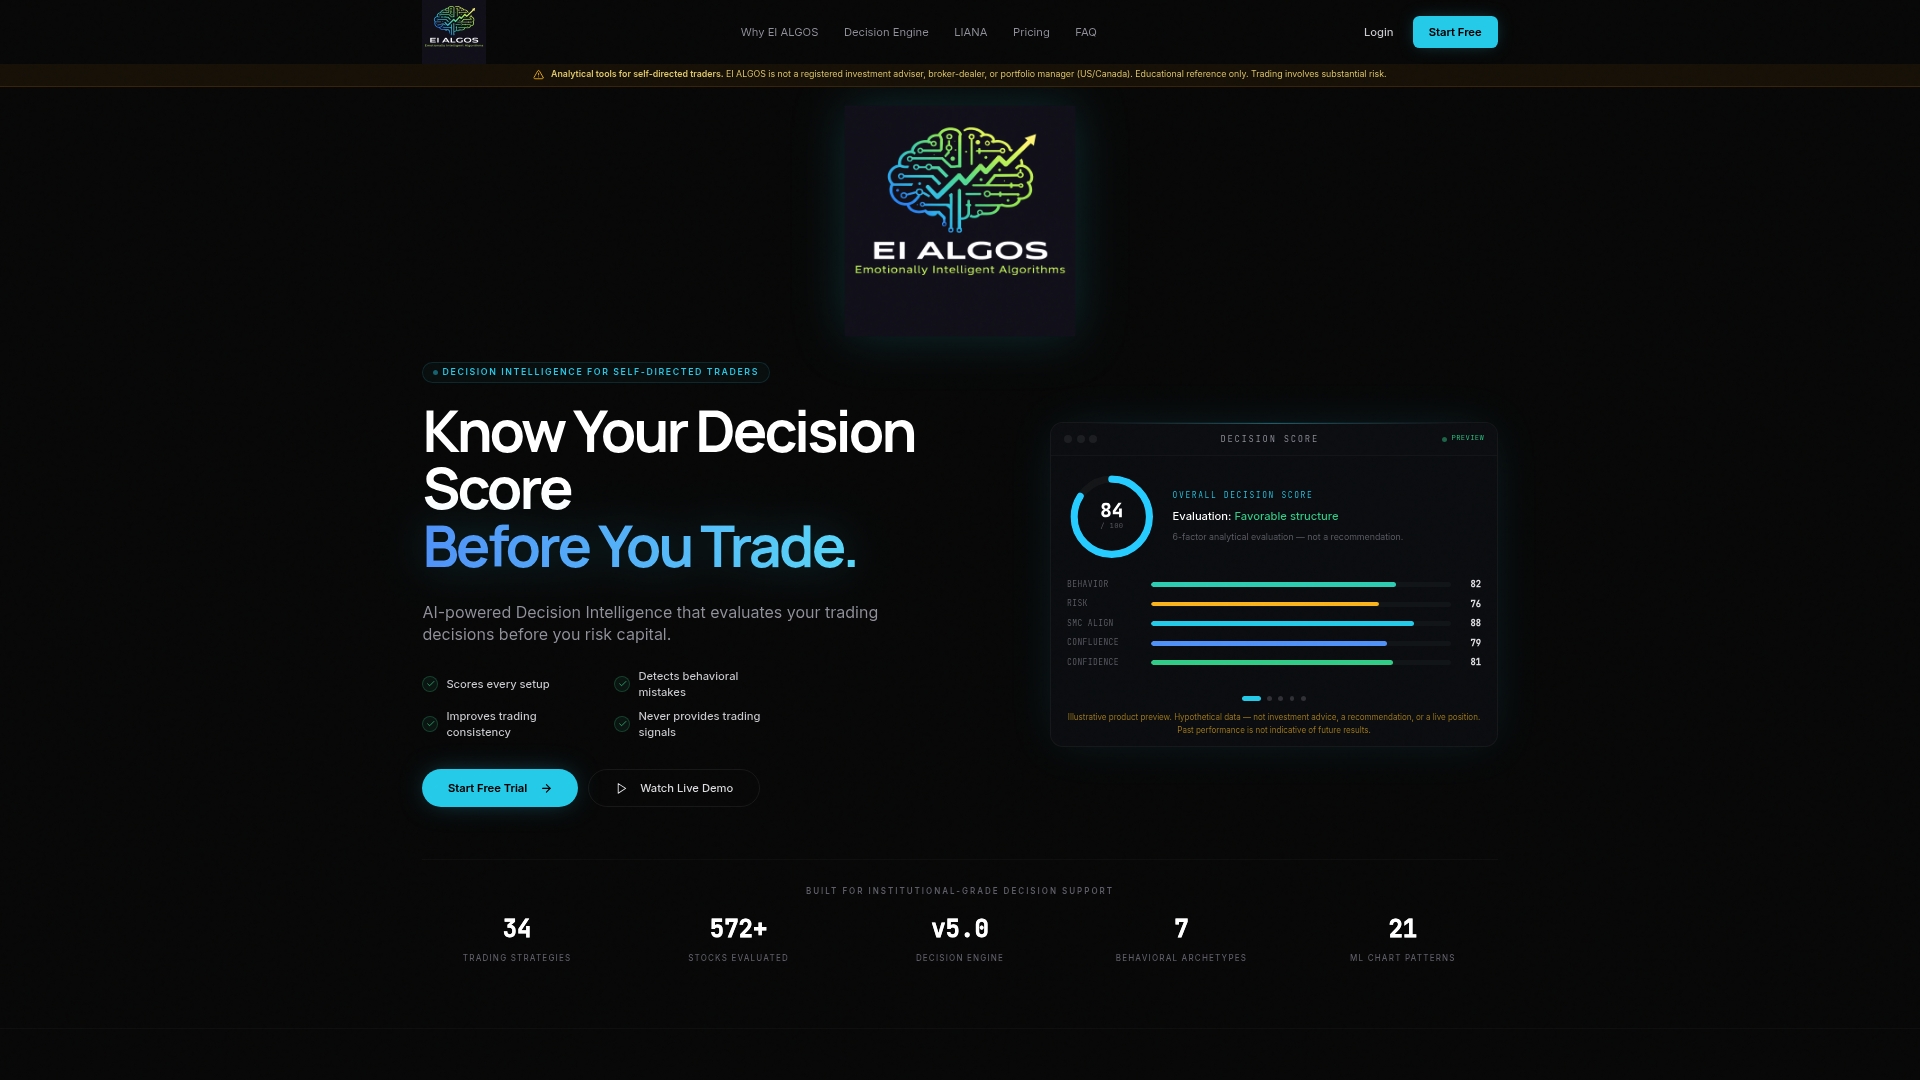
Profit factor shows the result of your decisions after the fact. EI ALGOS works earlier in the chain. It is a Decision Intelligence platform that scores each trade setup on a six-factor analytical engine focused on the psychological and behavioral side of the decision, detects behavioral errors, and does not issue trade signals or recommendations. Our LIANA assistant gives personalized feedback on your process based on your own trading patterns.

If you want to see how scoring works before you click the buy button on a trade, start with our step-by-step guide to scoring every trade before you click and our trade evaluation framework.
The platform has a Free plan at $0 per month. Paid plans are Starter at $49 per month, Pro at $129 per month and Elite at $229 per month, with the full list on our plans page.
For a closer look at how reviewing trades with a coach-style assistant works, see LIANA, the AI trading coach and our trading journal.
Our perspective
Most traders treat profit factor as a grade. We treat it as a symptom. A number of 1.2 does not say what to fix. It says that somewhere in your last 100 decisions, the payoff and the discipline did not line up.
That is why we do not build signals. A signal tells you what the market might do. It cannot tell you why you exited a winner after eight minutes or moved a stop for the third time. Those choices live in the trader, and they set the average win, the average loss and the win rate that make up the ratio.
Our approach is to score each setup before the trade, with six factors that look at the quality of the decision, then compare what you planned with what you did. Over time, you see which behaviors cost you gross profit and which protect it. Profit factor then becomes what it should be: a confirmation that your process is improving, not a number you chase.
Start with the Free plan, log your trades, and let your own data show where the ratio is won or lost.
Anantha
FAQ
What is a good profit factor for trading?
Many traders aim for 1.5 to 2.0 over a large sample that includes commissions and slippage. Values from 1.1 to 1.3 leave little room for error. The right target also depends on your strategy type and win rate.
Is a profit factor of 1.3 good?
It is profitable, but the cushion is narrow. A small rise in costs or a rough market stretch can bring it close to 1.0. If it holds across a large number of trades after costs, it is a reasonable base to improve from.
Is a profit factor of 1.8 good?
Yes, if it comes from enough trades and live or out-of-sample results. A 1.8 means $1.80 earned for every $1.00 lost. Remove your best trade and recompute: if it stays well above 1, the result is more likely to be durable.
What does a profit factor of 1.5 mean?
Your winning trades produced $1.50 for every $1.00 your losing trades cost. With a 40% win rate, it requires average winners of about 2.25 times the average loser. With a 60% win rate, average winners only need to be 1 times the size of losers.
Sources
- Profit Factor (Report Field), TradeStation Help
- How to Test and Interpret Trading System Performance, AAII Journal
- Profit factor analysis, The Algo Institute
- Evaluating Trading Systems
- CFTC press release 7465-16