
Trend following rules are systematic, price-first entry and exit instructions that tell you exactly when to get in, how much to risk, and when to get out, without discretion or guesswork. A one-line starter rule you can backtest today: buy when price closes above its 200-day high; exit on a 6× ATR trailing stop. That single rule captures the core logic that Michael Covel and the Turtle Traders built entire careers around, and it is the same logic that platforms like Eialgos help traders execute with behavioral discipline.
This guide delivers:
- The core components every trend-following system needs
- Five concrete rule families with pseudocode and parameter examples
- Timeframe and asset-fit guidance for U.S. markets
- ATR-based sizing and stop mechanics with a worked example
- A backtesting checklist to avoid overfitting
- Three to five plug-and-play starter templates
- Realistic expectations on win rates, drawdowns, and regime failures
- Process controls that reduce behavioral slippage when following low-win-rate rules
Key Takeaways
Trend-following rules work when you apply all five components consistently, test them rigorously out-of-sample, size positions to volatility, and enforce process controls that prevent behavioral slippage from eroding the edge.
| Point | Details |
|---|---|
| Five-component structure | Every system needs a trend filter, entry signal, exit rule, position sizing formula, and portfolio risk limits. |
| Starter template | The 50/200 MA crossover with a 3× ATR trailing stop is the lowest-complexity starting point for U.S. equity ETFs. |
| Sizing rule | Risk 1%–2% of equity per trade; use the ATR formula to calculate shares before placing any order. |
| Backtesting priority | Reserve 20%–30% of data for out-of-sample testing and run walk-forward validation before trading live. |
| Eialgos process layer | Eialgos scores each setup on six behavioral dimensions, helping traders follow their rules consistently through losing streaks. |
Table of Contents
- What trend following rules are actually made of
- Common rule families and how to implement them
- Which timeframes and assets suit trend following best?
- How to size positions and set stops that match trend-following logic
- How to backtest trend-following rules so the results mean something
- Three starter rule templates you can test this week
- What to realistically expect from trend-following rules
- How decision intelligence strengthens rule execution
- Sources
What trend following rules are actually made of
Every trend-following system shares the same five-part skeleton. Miss one component and the system breaks down in live trading.
1. Trend filter. This defines whether a market is trending at all. The most common filter is a 50/200-day moving-average crossover: price above the 200-day MA signals an uptrend; price below signals a downtrend. A sloping 50-day EMA combined with an ADX(14) reading above 25 adds a second confirmation layer that filters out range-bound noise.
2. Entry signal. The entry fires only when the trend filter is active. Common entry triggers include a new N-day high close (breakout), a moving-average crossover confirmation, or a momentum reading crossing zero. Specificity matters here: "buy on strength" is not a rule; "buy on a close above the 55-day high when ADX > 25" is.
3. Exit rule. Exits define your maximum loss and your profit capture. A trailing ATR stop lets winners run while locking in gains as the trend extends. A structure-break exit (price closes below the 20-day low) is simpler and equally valid. Never use a fixed profit target as your primary exit in trend following; it caps the large winners that make the math work.
4. Position sizing. Volatility-based sizing keeps each trade's dollar risk constant regardless of the asset's price level. The formula: position size = (account equity × risk fraction) ÷ ATR-dollar risk per share. Fixed-fraction sizing typically involves risking a small percentage of equity per trade, with common practice around one to two percent.
5. Portfolio-level risk controls. Per-trade risk caps, maximum simultaneous open positions, and correlation limits across assets prevent a single bad trade or correlated cluster from doing serious damage. Trend following works as a portfolio strategy, not a single-instrument bet.
Pro Tip: Keep your trend filter and entry signal on the same timeframe. Mixing a weekly trend filter with a daily entry is valid, but mixing a daily filter with a 5-minute entry creates a mismatch that inflates false signals and trade frequency simultaneously.
Common rule families and how to implement them
Five rule families cover the vast majority of professional trend-following systems. Each has a distinct signal type, parameter set, and trade cadence.
Momentum (MOM) rule
The MOM rule compares current price to price N periods ago, signaling an uptrend when price has increased over that period.
- Parameters: lookback of 12, 24, or 36 months (monthly rebalancing) or 63, 126, 252 days (daily)
- Entry: buy when 12-month return > 0; sell or short when 12-month return < 0
- Exit: reverse signal or trailing ATR stop
- Trade cadence: monthly rebalancing; 4–12 trades per year per asset
- Pseudocode:
if close / close[lookback] > 1: buy; elif close / close[lookback] < 1: sell
MAC (moving-average crossover) rule
The MAC rule fires when a fast MA crosses above a slow MA, signaling trend initiation.
- Parameters: fast/slow pairs such as 10/40, 20/60, or the classic 50/200
- Entry: buy when fast MA crosses above slow MA; sell when it crosses below
- Exit: opposite crossover or trailing stop
- Trade cadence: 6–20 trades per year depending on the pair
- Pseudocode:
if MA(fast) > MA(slow) and MA(fast)[1] <= MA(slow)[1]: buy
Moving Average Envelope (MAE) rule
The MAE adds percentage bands above and below a central MA. Entry fires when price breaks outside the envelope, confirming a strong directional move rather than routine oscillation.
- Parameters: 20-day MA with ±3%–5% bands; wider bands reduce trade frequency
- Entry: buy when close > upper band; sell when close < lower band
- Exit: price returns inside the envelope or ATR trailing stop
- Trade cadence: 8–15 trades per year; fewer than a raw crossover system
Donchian channel breakout
The Donchian channel plots the highest high and lowest low over N periods. A close above the upper channel is a long entry; a close below the lower channel is a short entry. The Turtle Traders used a 20-day channel for entries and a 10-day channel for exits, and a 55-day channel for longer-term positions.
- Parameters: 20/10 (entry/exit) for medium-term; 55/20 for longer-term
- Entry: buy on close above N-day high; sell on close below N-day low
- Exit: opposite channel break or ATR trailing stop
- Trade cadence: 10–25 trades per year on daily data
50/200 moving-average crossover: example trade walkthrough
- Filter check: SPY closes above its 200-day MA. ADX(14) = 28 (above 25). Trend filter is active.
- Entry signal: 50-day MA crosses above 200-day MA on a Tuesday close at $510.
- Stop placement: 14-day ATR = $6.20. Initial stop = $510 minus (3 × $6.20) = $491.40.
- Position size: Account = $100,000; risk per trade = 1% = $1,000. Shares = $1,000 ÷ ($510 minus $491.40) = 53 shares.
- Trail: As price rises, the stop trails up by 3× ATR from each new closing high.
- Exit: Price closes below the trailing stop at $548. Trade closed. Gain = $38 per share × 53 shares = $2,014.
Which timeframes and assets suit trend following best?
Timeframe choice changes everything: entry mechanics, trade frequency, and how much noise you tolerate.
Daily timeframe is the standard starting point for self-directed traders. It gives enough data for meaningful backtests, keeps transaction costs manageable, and aligns with the 20/55 Donchian and 50/200 MA crossover rules that most practitioners use. Expect 10–30 trades per year per asset on daily data.
Weekly timeframe reduces trade frequency further and filters out most short-term noise. The 50/200 MA crossover on weekly bars becomes a 10/40 weekly crossover in practice. Drawdowns can be deeper because stops are wider, but the signal quality tends to be higher.
Monthly timeframe suits the MOM rule. Monthly rebalancing is low-maintenance and has the strongest academic support. Research from NYU Stern documents persistent time-series momentum across asset classes at monthly horizons, which supports cross-asset diversification as a core professional practice.

Intraday timeframes are generally poor fits for trend following. Noise-to-signal ratios are high, transaction costs compound quickly, and the U.S. pattern day trader rule imposes a $25,000 minimum equity requirement for accounts making four or more day trades in five business days.
Asset fit matters as much as timeframe. Futures and commodities trend more reliably because they are driven by macroeconomic supply-demand cycles that persist for months. Equity index ETFs (SPY, QQQ, IWM) work well because they are liquid, have tight spreads, and trend during risk-on/risk-off cycles. Individual stocks trend but carry gap risk and earnings-event noise that can blow through stops. Avoid thinly traded ETFs; overnight gaps and wide bid-ask spreads erode the edge quickly.
Pro Tip: Use a higher-timeframe trend filter to gate lower-timeframe entries. If the weekly trend filter is bearish, skip daily long signals entirely. This one filter alone can cut false signals by a meaningful margin without changing your entry or exit rules.
How to size positions and set stops that match trend-following logic
The sizing and stop rules are where most self-directed traders lose the edge they built in backtesting.

ATR-based stop placement. Set your initial stop at 3–6× the 14-day ATR below your entry price. Engineering research on stop rules supports using multiple ATR multiples for both initial and trailing stops, with sizing scaled to volatility. A 3× ATR stop gives you room to survive normal volatility; a 6× ATR stop is appropriate for more volatile assets like commodities or small-cap ETFs.
Volatility-based position sizing formula:
Position size = $1,000 ÷ $13.50 = 74 shares.
This approach keeps losses small during losing streaks and lets the account compound during winning streaks without over-leveraging.
Kelly-derived sizing. Full Kelly is too aggressive for trend following because win rates are low. A quarter-Kelly or half-Kelly fraction is more appropriate. In practice, most professional CTAs use fixed-fraction rules that approximate conservative Kelly fractions without requiring precise win-rate estimates.
Portfolio-level constraints to enforce:
- Cap per-trade risk at 1%–2% of equity
- Limit total open risk across all positions to 10%–15% of equity
- Avoid holding more than two to three highly correlated assets simultaneously (e.g., crude oil and natural gas, or SPY and QQQ)
- Reduce position size by 50% after a drawdown exceeds 15% from peak equity
Trailing stop mechanics. After entry, trail the stop up by 3× ATR from each new closing high. Never lower a stop. If price makes a new high on Monday and pulls back Tuesday, the stop stays at Monday's level. This asymmetry is what lets winners run while capping losses.
Partial profit-taking (selling half the position at 2× ATR gain, trailing the rest) reduces volatility of returns but also reduces average winner size. For pure trend following, a full trailing stop is mathematically superior over large samples, though it requires accepting larger swings in open P&L.
How to backtest trend-following rules so the results mean something
A backtest that does not survive out-of-sample testing is a historical curiosity, not a trading edge. Use this checklist before trusting any result.
Data quality first:
- Use adjusted price data (split and dividend-adjusted) for stocks and ETFs
- Use continuous contracts or back-adjusted data for futures
- Check for survivorship bias: include delisted stocks and failed ETFs in equity universe tests
- Minimum recommended history: 15–20 years covering at least one full bull/bear cycle
Realistic cost modeling:
- Add $0.01–$0.02 per share slippage on entries and exits for liquid U.S. equities
- Use actual bid-ask spread data for ETFs; assume 0.05%–0.10% round-trip for liquid futures
- Include brokerage commissions even if they are small; they compound across hundreds of trades
Out-of-sample and walk-forward testing:
- Reserve the last 20%–30% of your data as a hold-out test set; never optimize on it
- Run walk-forward validation: optimize on a rolling 5-year window, test on the next 1–2 years, repeat
- Academic and practitioner work on momentum robustness underscores the need for rigorous out-of-sample and walk-forward testing to avoid overfitting parameter choices
Parameter sensitivity check:
- Vary each parameter by ±20% and confirm the strategy remains profitable; a result that collapses when the lookback changes from 200 to 180 days is curve-fitted
- Test across multiple assets simultaneously; a rule that works only on one ticker is not a trend-following rule, it is a coincidence
Key metrics to record for every backtest:
- Compound annual growth rate (CAGR)
- Maximum drawdown (peak-to-trough, both percentage and duration)
- Sharpe ratio (target above 0.5 for a trend-following system)
- Win rate and average win-to-loss ratio
- Trade expectancy = (win rate × average win) minus (loss rate × average loss)
- Average trade duration and annual trade count
Common pitfalls:
- Look-ahead bias: using data that would not have been available at the time of the signal (e.g., using the day's close to trigger an intraday entry)
- Survivorship bias: testing only on stocks that still exist today inflates results significantly
- Curve-fitting: optimizing too many parameters on too little data; keep parameter count below four for a starter system
For large-sample stress-testing across multiple asset classes, Assymetrix's backtesting API provides access to extensive price snapshots useful for cross-market validation.
Three starter rule templates you can test this week
Pick one template, gather clean data, and run a backtest before adding complexity.
Template 1: Donchian 20/55 breakout
- Rule family: Donchian channel breakout
- Parameters: 55-day entry channel, 20-day exit channel, 14-day ATR for sizing
- Entry: Buy on close above 55-day high; sell short on close below 55-day low
- Exit: Close long when price closes below 20-day low; close short when price closes above 20-day high
- Stop: 3× ATR trailing stop from entry
- Expected trade count: 10–20 per year per asset on daily data
- Typical hold time: 4–12 weeks
- Assets: Liquid futures (ES, CL, GC), commodity ETFs (GLD, USO)
- Capital note: Works best in a diversified portfolio of 8–12 uncorrelated markets
Template 2: 50/200 MA crossover with ATR trail
- Rule family: Moving-average crossover (MAC)
- Parameters: 50-day MA, 200-day MA, 14-day ATR, 3× ATR initial stop
- Entry: Buy when 50-day MA crosses above 200-day MA; sell when it crosses below
- Exit: Opposite crossover or 3× ATR trailing stop, whichever fires first
- Expected trade count: 4–8 per year per asset
- Typical hold time: 3–9 months
- Assets: U.S. equity ETFs (SPY, QQQ, IWM), sector ETFs
- Capital note: Low trade frequency; suitable for accounts under $50,000 due to low commission drag
Template 3: 12-month momentum (MOM) with monthly rebalance
- Rule family: Momentum (MOM)
- Parameters: 12-month lookback, monthly rebalancing, top-quartile ranking across a universe of 20+ assets
- Entry: Buy the top quartile of assets by 12-month return at each monthly rebalance
- Exit: Drop any asset that falls out of the top quartile at the next rebalance
- Stop: 6× ATR trailing stop as a hard floor between rebalances
- Expected trade count: 20–40 per year across a 20-asset universe
- Typical hold time: 1–6 months
- Assets: Diversified ETF universe (equities, bonds, commodities, REITs)
- Capital note: Requires at least $30,000 to diversify across 8–10 positions at 1% risk per trade
Template 4: ATR-trail breakout (200-day high)
- Rule family: Breakout with ATR trailing stop
- Parameters: 200-day high for entry, 14-day ATR, 6× ATR trailing stop
- Entry: Buy on close above 200-day high
- Exit: 6× ATR trailing stop from the highest close since entry
- Expected trade count: 5–15 per year per asset
- Typical hold time: 2–8 months
- Assets: Individual U.S. stocks (large-cap, liquid), equity ETFs
- Capital note: The 6× ATR stop is wide; size positions at 0.5%–1% risk per trade to avoid oversized losses
Implementation checklist for all templates:
- Data: daily OHLCV, adjusted for splits and dividends, minimum 15 years
- Order type: limit orders at the prior close or market-on-open to minimize slippage
- Slippage assumption: $0.01–$0.02 per share for U.S. equities; 0.05% for ETFs
- Record every trade: entry date, exit date, entry price, exit price, stop level, position size, P&L
What to realistically expect from trend-following rules
Trend following aims to capture large directional moves, but the practical challenges of spotting trend starts and ends mean the path is rarely smooth.
The win-rate reality. Trend-following systems often produce relatively low win rates, reflecting many small losses offset by larger winners. The math still works because average winners are two to four times larger than average losers. Most of the annual return comes from a handful of trades per year; the rest are small losses or breakevens. Accepting this distribution is the central behavioral challenge of the method.
Pros of systematic trend following:
- Uncapped upside: a trailing stop lets a position run as long as the trend holds
- Systematic discipline: rules remove the temptation to override entries and exits
- Cross-asset diversification: time-series momentum has shown persistence across equities, bonds, commodities, and currencies, as documented in multi-asset momentum research
- Scalability: rules can be applied across dozens of markets simultaneously
Cons and realistic drawbacks:
- Long flat periods: trend following can underperform buy-and-hold for 2–4 years during range-bound markets
- Many small losses: a 40% win rate means six losses for every ten trades; most traders abandon the system before the large winners arrive
- Regime sensitivity: the method fails in choppy, mean-reverting markets where price oscillates without establishing a direction
When trend following fails. High-chop, low-volatility regimes are the enemy. When the VIX is compressed and markets trade in a narrow range, breakout signals produce whipsaws and the ATR-based stops get hit repeatedly. Detecting regime changes early using an ADX filter (ADX < 20 signals low trend strength) or a volatility regime indicator helps you reduce position size or step aside entirely. Practitioner guides recommend combining a sloping EMA, higher-high/higher-low confirmation, and an ADX(14) check above 25 to filter out range markets before entry.
Behavioral challenges and how to address them:
- Holding winners: set a rule that you cannot manually close a position before the trailing stop fires
- Accepting losses: pre-commit to the maximum loss per trade before entry; the stop is not negotiable
- Ignoring short-term drawdowns: track rolling 12-month performance, not daily P&L, to maintain perspective
How decision intelligence strengthens rule execution
Rules on paper and rules in live trading are two different things. The gap between them is behavioral slippage: overriding stops, skipping valid entries after a losing streak, or sizing up impulsively after a big winner.
A decision-intelligence layer addresses this directly. Before executing a trade, a process-oriented system evaluates whether you are in the right psychological state to follow your rules, whether the setup meets all five components of your system, and whether your current drawdown level warrants reduced sizing. After a rule violation, a forced cooling-off period prevents compounding errors.
Process control checklist for live trading:
- Pre-trade decision score: does the setup satisfy all five rule components? Score it before entry
- Sizing enforcement: calculate position size from the formula before placing the order; never estimate
- Post-violation rule: after any discretionary override, reduce position size by 50% for the next five trades
- Decision log: record the reason for every entry and exit, including whether it was rule-based or discretionary
Eialgos's platform applies this logic through a six-factor analytical engine that scores each trade setup on behavioral and process dimensions before execution. The LIANA assistant tracks your decision patterns over time, flagging recurring behavioral errors so they become measurable signals rather than invisible habits. Pairing process-oriented trading with a structured rule set is how systematic discipline becomes a repeatable skill rather than an occasional achievement.
Pro Tip: Keep a minimal live decision log: date, setup score, rule-based or discretionary, outcome. After 50 trades, the pattern of your behavioral errors will be visible. That data is more valuable than any indicator tweak.
What I've learned from running trend rules through losing streaks
The hardest part of trend following is not finding the rules. It is sitting through 12 consecutive small losses while the system tells you to keep taking the next valid signal. Most traders abandon the system at exactly the wrong moment, right before a large trend materializes.
The one habit that changed my execution was a daily decision checklist completed before the market opens. Not a market forecast. A process check: is my sizing correct? Is my stop pre-set? Am I trading because the rule fired, or because I feel like trading? That checklist, completed consistently, is worth more than any parameter optimization. Automated size limits enforced at the order level remove the temptation to override sizing under pressure. The rules are not the hard part. Trusting them when they are losing is.
Eialgos scores your decision process, not just your trades
Trend-following rules give you the what. Eialgos gives you the why behind every decision you make while running them.
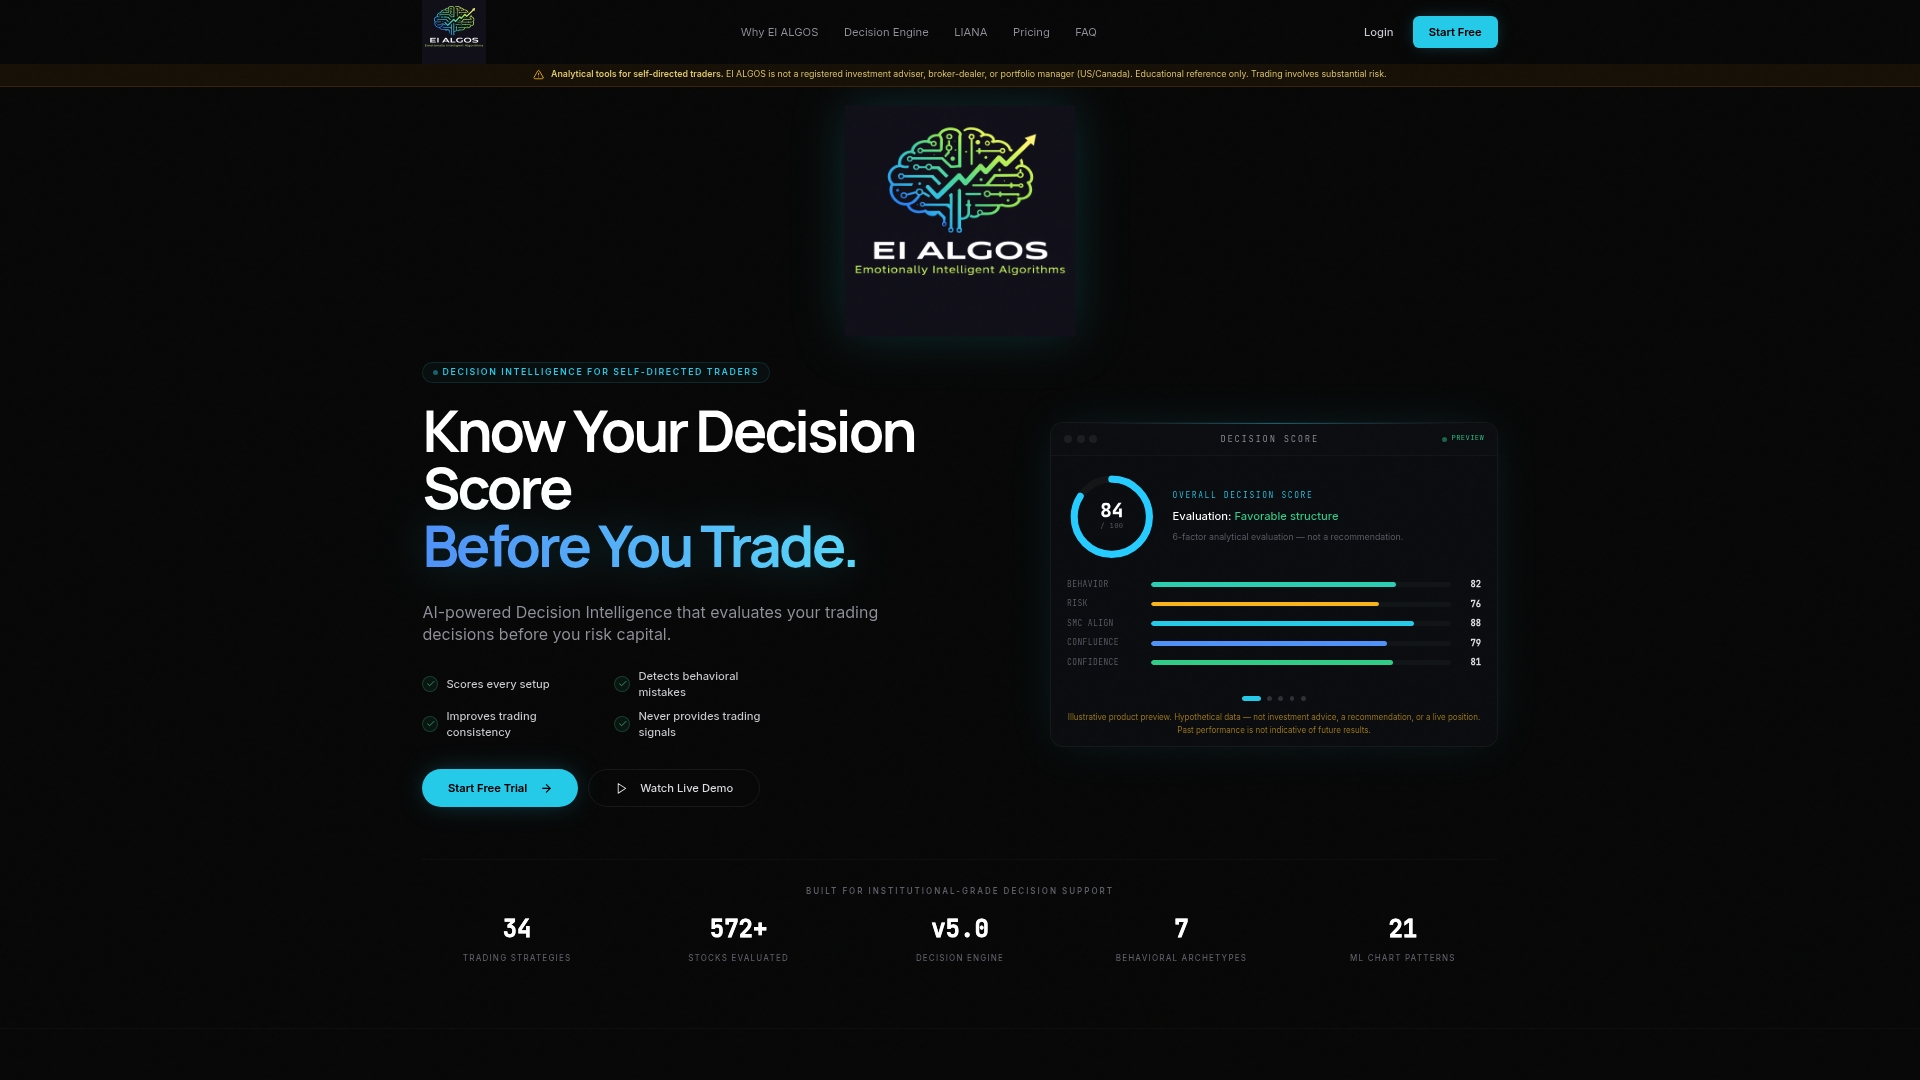
The platform's six-factor engine scores each trade setup on behavioral and process dimensions before you execute, flags rule violations in real time, and tracks your decision patterns through LIANA so you can see exactly where behavioral slippage is costing you. It complements your rule set without replacing it: your entries, exits, and stops stay yours. Eialgos measures whether you are actually following them.
Start with the Decision Intelligence guide to see how process scoring works alongside your existing templates, or explore the subscription plans to add behavioral tracking to your live trading. This is general information, not trading advice. Always backtest and validate any strategy for your own circumstances before trading with real capital.
Sources
The sources below are the most authoritative starting points for building, testing, and refining trend-following systems.
- Time Series Momentum (PDF) - NYU Stern faculty page
- Trend following trading - Wikipedia
- Trend Following | Strategy, Signals, Risks, & Technical Indicators | Britannica Money
- Trend Trading Strategy: Ride Momentum in 2026 Updated April 2026 - TradingSim
- Archive
This article is general information, not a substitute for advice from a qualified financial advisor. Consult a qualified financial professional about your own circumstances before acting on anything here.